Enhancing SQL Server Integration Services (SSIS) Functionality Through Python Scripting
Ever since Python started to gain traction in the developers community as one of the most versatile and easy to learn programming language, Microsoft has made great strides to make it a first-class citizen in its ecosystem. Python Tools for Visual Studio, tight Python libraries integration with the .NET framework in IronPython project, the availability of the Python SDK on Windows Azure or even the latest addition of Python in Azure Machine Learning service are just a few examples of how Microsoft takes Python popularity more seriously these days. However, when it comes to tools such as Integration Services, C# and VB.NET are the only two options provided to extend built-in SSIS functionality out of the box. Whilst both languages are powerful enough to give the BI developers the tools needed to supplement default SSIS transformations, the entry barrier is often too high and reserved for those commanding a good understanding of .NET libraries and C# of VB.NET syntax. Also, both languages are often perceived as too verbose to use to build simple scripts dealing with rudimentary tasks such as reading and writing text files, working with Excel files, sending e-mails etc. That’s where high-level languages shine and that’s where Python often comes in handy in my experience.
SSIS execute Process Task allows the package to run Win32 executables or batch files. In this way, providing we have Python installed and added to the path, we can run Python scripts either through (1) directly invoking Python interpreter and passing the Python script name as an argument or (2) by wrapping it the script in a .bat file. Alternatively, (3) we can ‘freeze’ Python code as an executable – an option I have also explored in this post. Firstly, let’s explore options 1 and 2 and create a sample Python file in a C:\ directory along with a batch file to wrap the script in. Python script will be called PyScript1.py whereas the batch file – BatPyScript1.bat
#Python code saved as PyScript1.py
print ('This is how PRINT statement works in Python')
input('Press ENTER to continue...')

#Batch file code to execute the above Python code
#saved as BatPyScript1.bat under directly C:\ drive
python c:\PyScript1.py
The above code is very rudimentary and does not provide any functionality besides printing out a dummy string in a console window but is a good example of how python scripts can be invoked from the Execute Process Task. The below video clip outlines how PyScript1.py Python script can be triggered using SQL Server Integration Services task. Also, notice that FailTaskIfReturnCodeIsNotSuccessValue parameter needs to be set to False if we execute the script from a batch file.
Python being a general-purpose, high-level programming language can support or perform a variety of tasks to enhance ETL development (not only SSIS). Perceived by many as easy to learn, super productive and with a generous Standard Library (batteries included), Python can provide a great deal of functionality with hardly any code. Let’s explore a few examples of how Python can be used to scrape some data off a website, save it in a CSV file, transfer it into the SQL Server database and finally generate and email some basic reports based on this data.
Let’s assume that we would like to scrape stock prices data of the following website (click on image to expand).
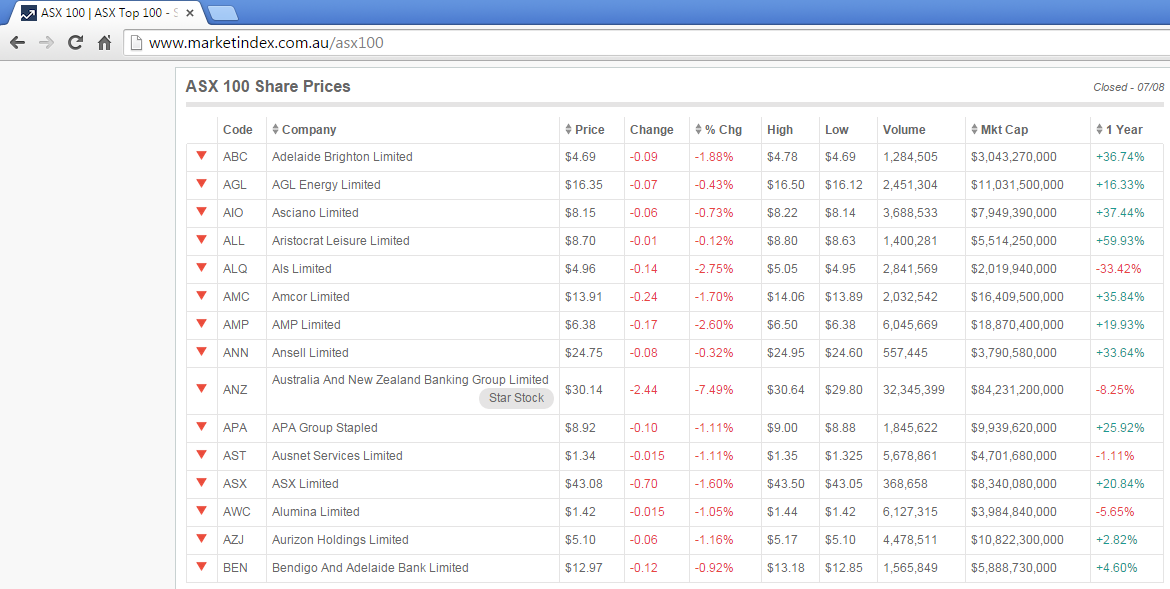
There are several libraries which can be used for web scraping but the most popular by far and the one we’re using here is Beautiful Soup – a Python package for parsing HTML and XML documents (including having malformed markup, i.e. non-closed tags, so named after Tag soup). The columns we are interested in are the company code and the share price only. As part of this exercise we will also add an ‘extract date and time’ column to be able to pinpoint when the data was scraped. The data will be saved in C:\Imports folder as a CSV file with an extracted date and time as part of the file name.
from urllib.request import urlopen
import csv
import datetime
import time
import os
from bs4 import BeautifulSoup
savePathImports = 'C:\\Imports'
if not os.path.exists(savePathImports):
    os.makedirs(savePathImports)
urlToOpen = 'http://www.marketindex.com.au/asx100'
soup = BeautifulSoup(urlopen(urlToOpen).read())
filename = time.strftime("extract_%d%b%Y_%H%M%S.csv")
csvFile = open(savePathImports + '\\' + filename,'wt',newline='')
writer = csv.writer(csvFile)
writer.writerow(["Company Code", "Share Price", "Extract DateTime"])
try:
    for row in soup("table", {"id": "asx_sp_table" })[0].tbody('tr'):
        tds = row('td')
        csvRow = []
        csvRow.append(tds[1].string)
        csvRow.append(tds[3].string.replace("$", ""))
        csvRow.append(datetime.datetime.now().strftime("%Y-%m-%d %H:%M:%S"))
        writer.writerow(csvRow)
finally:
    csvFile.close()
Further on, now that we have the data scraped, let’s assume that rather then storing it in a CSV file, we would like to insert it into the SQL Server database. There are many good libraries that can enable Python to SQL Server instance interface – in this example I used PyPyODBC purely because of good Python 3.4 support. The below snippet creates ‘stock_prices’ table on the default ‘dbo’ schema, inserts the data from the CSV file created by the code above and appends ‘insert_datetime’ data to the table.
import pypyodbc
import datetime
import glob
import csv
import os

#define SQL Server database connection details,
#establish the connection and drop/create 'stock_prices' table
conn = pypyodbc.connect('Driver={SQL Server};'
                        'Server=ServerName\InstanceName;'
                        'Database=DatabaseName;'
                        'uid=Login;pwd=Password')
cur = conn.cursor()
cur.execute('''IF OBJECT_ID(N'dbo.stock_prices', N'U') IS NOT NULL
	        DROP TABLE dbo.stock_prices;
            CREATE TABLE stock_prices
            (id int IDENTITY (1,1),
            company_code CHAR (3) NOT NULL,
            share_price DECIMAL(6,2) NOT NULL,
            extract_datetime DATE NOT NULL,
            insert_datetime DATE);
            ''')
cur.commit()

#import data from CSV file into the SQL Server table skipping
#first/header row and append current 'time stamp' column
filesLocation = 'C:\\Imports'
import_data = []
current_timestamp = str(datetime.datetime.now().strftime("%Y-%m-%d %H:%M:%S"))
os.chdir(filesLocation)
for csvFile in glob.glob("*.csv"):
    with open(csvFile, 'r') as f:
        reader = csv.reader(f)
        next(reader, None)
        import_data = [tuple(line + [current_timestamp]) for line in csv.reader(f)]

cur.executemany('''INSERT INTO dbo.stock_prices
                (company_code,share_price,extract_datetime,insert_datetime)
                VALUES (?,?,?,?)''',import_data)
cur.commit()

#close database connection
conn.close()
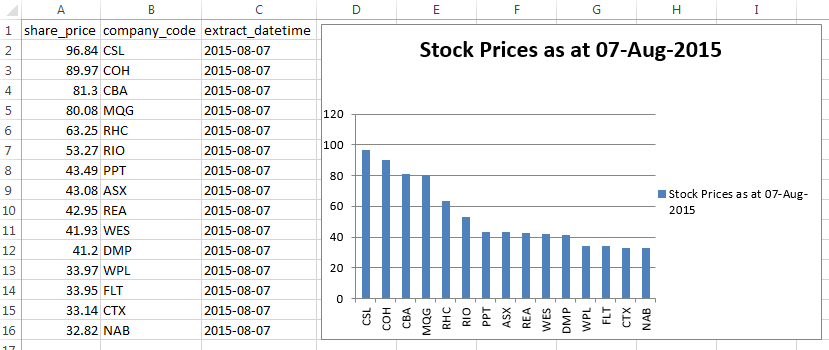
There is no point in storing the data in a database (or flat files) if you can’t do anything with it. The next snippet of code extracts the stock prices data from the database and creates a very simple Excel report using openpyxl library. First let’s create a sample empty Excel spreadsheet file in the Report subdirectory of Imports folder. Next, let’s assume that the report requires us to provide the data for the top 15 most expensive stocks on the market for the data we have scraped. On top of that we would like to have it graphed in the same workbook and e-mailed to a recipient. While SQL Server built-in features can partially cater for these requirements e.g. SQL Server database mail can handle e-mail distribution functionality, creating reports with built-in graphs requires a programmatic approach and that is where Python’s simplicity and flexibility shine.
The below code imports the data from SQL Server instance which has previously been scraped from the website featuring stock prices, imports it into the spreadsheet file, creates a simple bar graph from the first 2 columns (stock price and company code) and finally e-mails it to a recipient using smtplib library. A lot of functionality for a very small amount of code!
import openpyxl
import pypyodbc
import time
import os
import smtplib
from email import encoders
from email.mime.base import MIMEBase
from email.mime.multipart import MIMEMultipart
from email.utils import formatdate

#define SQL Server database connection details and report file path
savePathReport = 'C:\\Imports\Report'
xlsxReportName = 'samplereport.xlsx'
conn = pypyodbc.connect('Driver={SQL Server};'
                        'Server=ServerName\InstanceName;'
                        'Database=DatabaseName;'
                        'uid=Login;pwd=Password')
cur = conn.cursor()
os.chdir(savePathReport)

#open Excel spreadsheet, rename active workbook to 'samplereport_DDMonthYY'
wb = openpyxl.load_workbook(xlsxReportName)
sheet = wb.get_active_sheet()
wb.remove_sheet(sheet)
wb.create_sheet(title=time.strftime("samplereport_%d%b%Y"))
sheet = wb.get_active_sheet()

#get the data (share price, company code and date for the top 15 most expensive
# shares out of SQL Server table and insert it into the report/spreadsheet
cur.execute("""SELECT TOP 15 share_price,
               company_code, extract_datetime,
               rank() OVER (ORDER BY share_price DESC) +1 as row_number
               FROM [AdminDBA].[dbo].[stock_prices]
               ORDER BY share_price DESC""")
dbTblHeader = [item[0] for item in cur.description]
del dbTblHeader[-1]
sheet.append(dbTblHeader)
for row in cur.fetchall():
    sheet['A' + str(row[3])] = float(row[0])
    sheet['B' + str(row[3])] = row[1]
    sheet['C' + str(row[3])] = row[2]

#create a simple bar graph from the report data on the same workbook
values = openpyxl.charts.Reference(sheet, (2, 1), (16, 1))
labels = openpyxl.charts.Reference(sheet, (2, 2), (16, 2))
seriesObj = openpyxl.charts.Series(values, labels = labels, title='Stock Prices as at '+time.strftime("%d-%b-%Y"))
chartObj = openpyxl.charts.BarChart()
chartObj.append(seriesObj)
chartObj.drawing.top = 5
chartObj.drawing.left = 300
chartObj.drawing.width = 500
chartObj.drawing.height = 315
sheet.add_chart(chartObj)
wb.save(xlsxReportName)
cur.close()
conn.close()

#send e-mail to designated e-mail address
#with Excel spreadsheet attachment
attachmentPath = savePathReport+'\\'+xlsxReportName
sender = 'senders_email_address@domain_name.com'
recipient = 'recipient_email_address@domain_name.com'
sendersEmailLogin = 'Password'
HOST = "smtp.gmail.com" #other smtp providers include outlook/hotmail @ smtp-mail.outlook.com or Yahoo Mail @ smtp.mail.yahoo.com
msg = MIMEMultipart()
msg["From"] = sender
msg["To"] = recipient
msg["Subject"] = "Share Prices report for " + time.strftime("%d-%b-%Y")
msg['Date'] = formatdate(localtime=True)
part = MIMEBase('application', "octet-stream")
part.set_payload( open(attachmentPath,"rb").read())
encoders.encode_base64(part)
part.add_header('Content-Disposition', 'attachment; filename="%s"' % os.path.basename(attachmentPath))
msg.attach(part)
server = smtplib.SMTP(HOST, 587)
server.ehlo()
server.starttls()
server.login(sender, sendersEmailLogin)
server.sendmail(sender, recipient, msg.as_string())
server.close()
The final output in C:\Imports\Report folder should be an Excel spreadsheet containing the data and a simple graph as per the image below.
While Python can easily be installed on any system (some even coming with Python pre-installed), under some circumstances it may not be desirable or permitted to install third party software on certain environments. In these cases Python files can be compiled into executable files (DOS, OpenVMS, Microsoft Windows, Symbian or OS/2.) using a few different utilities e.g. py2exe or cx_freeze.
Let’s combine the above code into one executable using py2exe. py2exe is a Python extension which converts Python scripts (.py) into Microsoft Windows executables (.exe). These executables can run on a system without Python installed and the process is very straightforward. Depending on which version of Python you run, you will need to download applicable version of py2exe. As my installation is version 3.4 I downloaded it from HERE. All we need to do now is to create a ‘setup’ Python script, saving it in the same folder as the python file that needs to be converted and invoke py2exe from the command line. This will create a sub-folder called ‘dist’ where the executable will be created. The following code is the simplest version of the setup.py file.
from distutils.core import setup
import py2exe
setup(console=["filename.py"])
Once saved in a file we can reference it in the terminal with the following command.
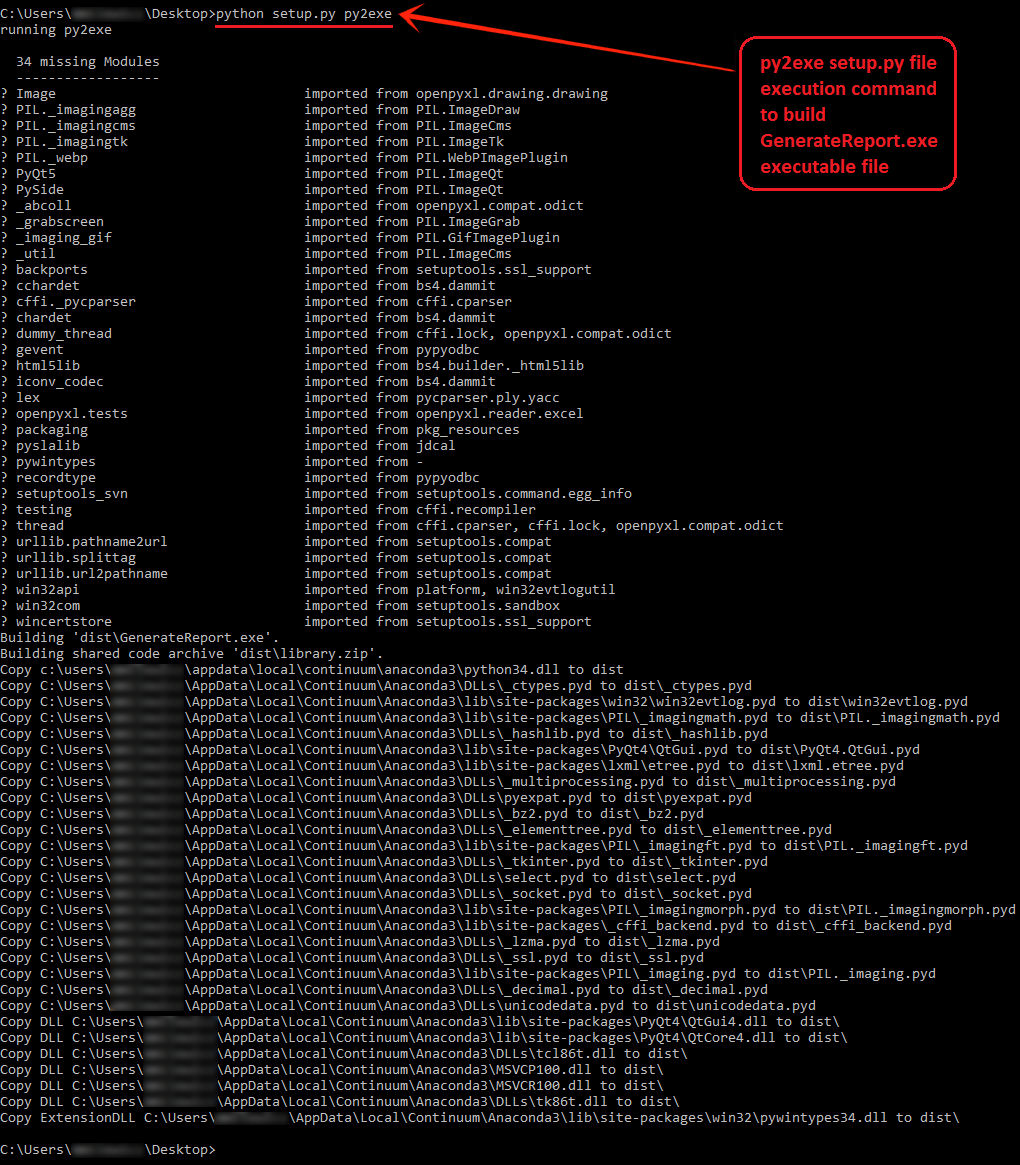
python setup.py py2exe
Below is the output generated by this process (as my default Python installation is a distribution from Continuum Analytics called Anaconda, you can see a lot of DLLs and Python modules being referenced as part of the compilation).
Once the executable file is generated we can easily reference it as part of the ETL process, calling the file in the Execute Process Task transformation or even through xp_cmdshell form an SQL statement.
SQL Server Integration Services functionality allows the developers to complete a vast plethora of tasks and further extend its capabilities through .NET languages implementation, however, Python’s sublime flexibility coupled with the ease of development not only provides somewhat gentler entry point into the programming realm but also allows for complex task execution with minimal development input.
http://scuttle.org/bookmarks.php/pass?action=addThis entry was posted on Saturday, August 8th, 2015 at 1:09 pm and is filed under Programming, SQL Server, SSIS. You can follow any responses to this entry through the RSS 2.0 feed. You can leave a response, or trackback from your own site.


admin March 24th, 2016 at 3:18 am
Hi Ken
Sorry to hear you’re having troubles replicating this solution. It looks like it’s a driver/database or SQL related error. Perhaps before inserting data you should ensure that the connection details are valid using a combination of SELECT (SQL) and PRINT (Python) statements. In that way you’ll know for sure that your database interface has been set up correctly.
Hope that helps……….cheers, Martin