Microsoft SQL Server Hardware Evaluation and Sizing – Best Practices Guide (Part 2)
Continuing on from the FIRST post to this series, this installment focuses on arguably the most important aspects of SQL Server hardware sizing – CPU, RAM and storage selection. Let’s start with a processor selection.
CPU
Central processing unit is the heart of every system and that is particularly evident when dealing with database workloads as CPU selection drives other components selection e.g. how many CPU sockets you can have in the server, physical memory capacity, I/O capacity and upgrade path etc. SQL Server can work with both – Intel and AMD processors, however, there are some distinct differences between the two options. Intel has been dominating the single-threaded performance race for a long time now whereas most modern AMD CPUs have a high physical core count which sometimes makes them more suitable, when compared to Intel counterparts, for certain types of deployments e.g. SQL Server Business Intelligence edition (licensed per server + CALs rather than cores). Starting with SQL Server 2012 version Microsoft introduced SQL Server Core Factor table which allows for up to 25 percent discount when licensing a server with AMD CPUs, however, AMD CPUs are still difficult to recommend given their lower overall single-threaded performance and increased licensing cost. As a result of that I will only be discussing Intel CPUs selection for SQL Server deployments.
Based on the current range of CPUs from Intel (Q1, 2015), the following processor models constitute my recommendation selection for both OLTP and DW/DSS workloads based on the socket types.
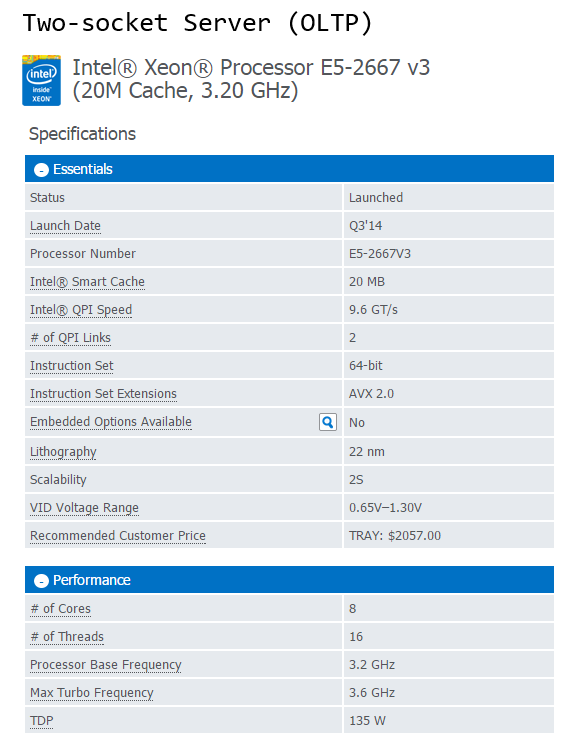
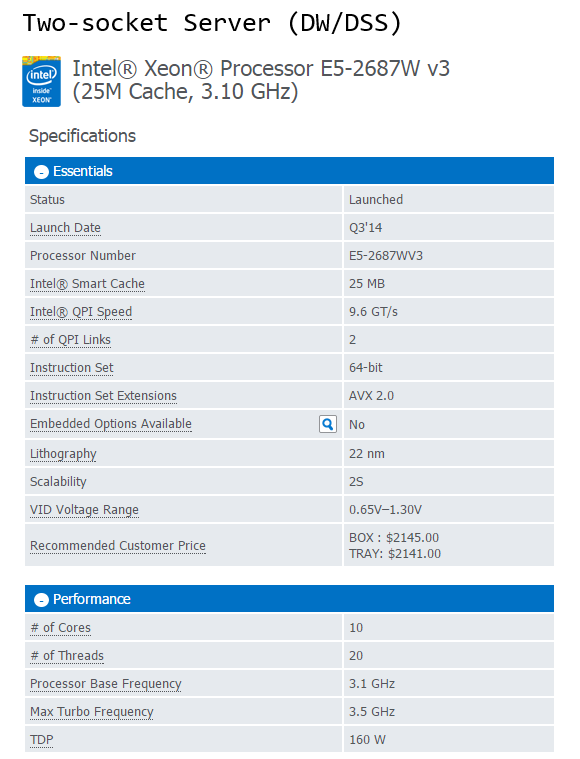
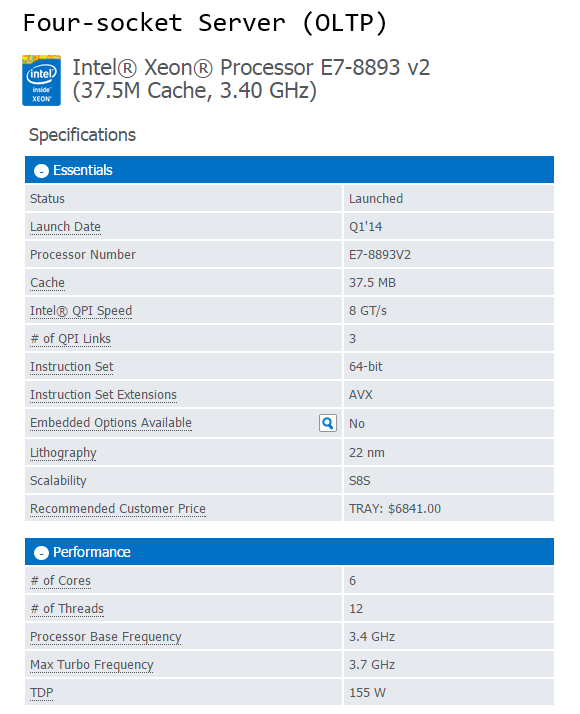
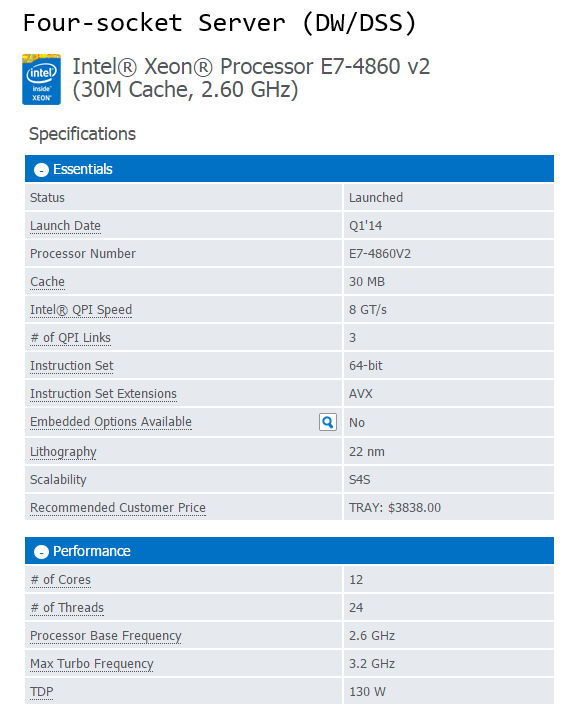
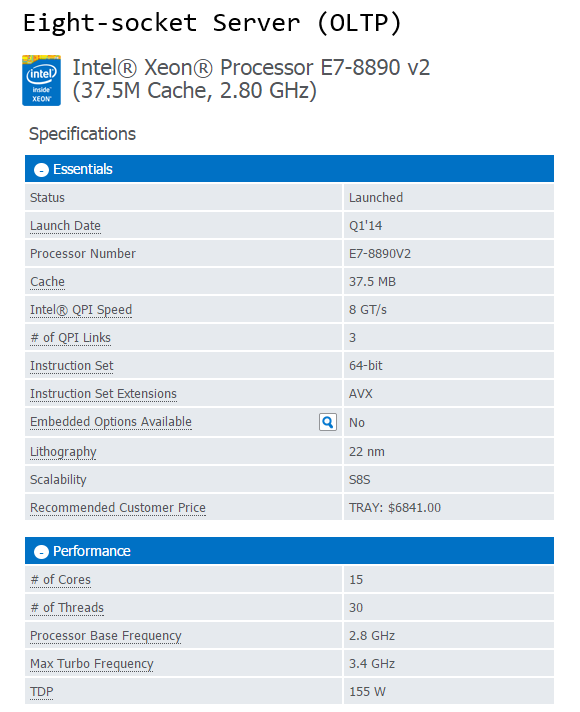
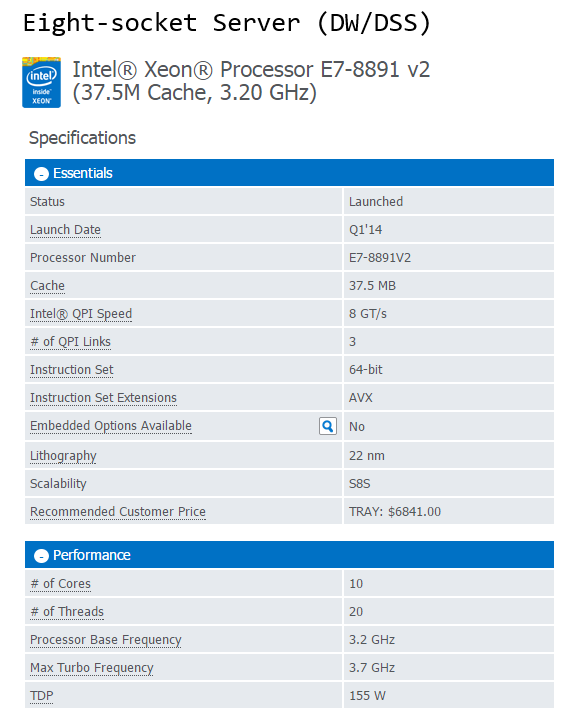
As new and improved processors are introduced the above list will gradually become less applicable so make sure you look at Intel website for new or upcoming releases. Also, rather than just taking a blind shot at the CPU model, it is always a good practice to analyse CPU’s performance using benchmarking tools or at least look at the scores obtained by the systems utilizing those chips if available online. The two most commonly used ones are TPC-E (OLTP focused) and TPC-H (Decision Support focused) benchmarks.
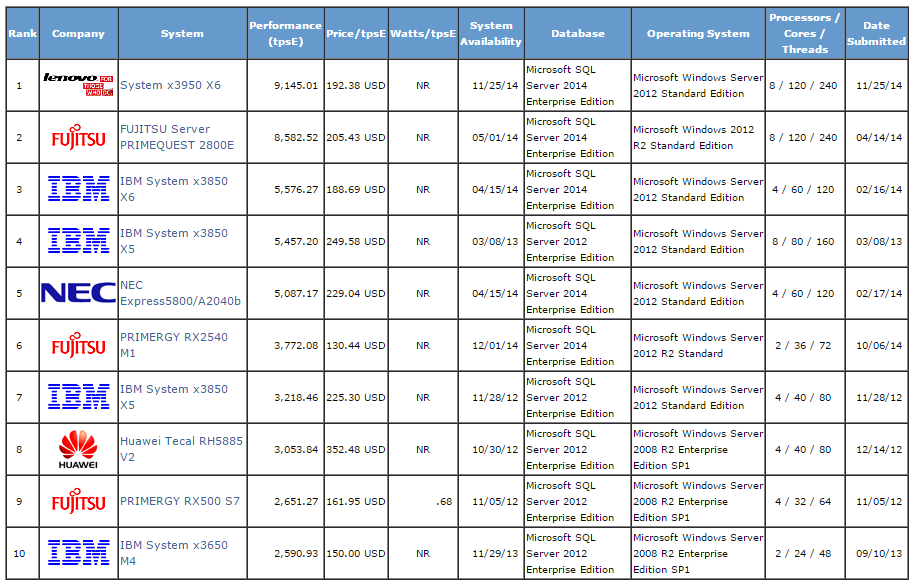
TPC Benchmark™ E (TPC-E) is an On-Line Transaction Processing (OLTP) workload developed by the TPC. The TPC-E benchmark uses a database to model a brokerage firm with customers who generate transactions related to trades, account inquiries, and market research. The brokerage firm in turn interacts with financial markets to execute orders on behalf of the customers and updates relevant account information. The benchmark is “scalable,” meaning that the number of customers defined for the brokerage firm can be varied to represent the workloads of different-size businesses. The benchmark defines the required mix of transactions the benchmark must maintain. The TPC-E metric is given in transactions per second (tps). It specifically refers to the number of Trade-Result transactions the server can sustain over a period of time. Although the underlying business model of TPC-E is a brokerage firm, the database schema, data population, transactions, and implementation rules have been designed to be broadly representative of modern OLTP systems.
Current (18 March, 2015) top TPC-E performers are as per the screenshot below.
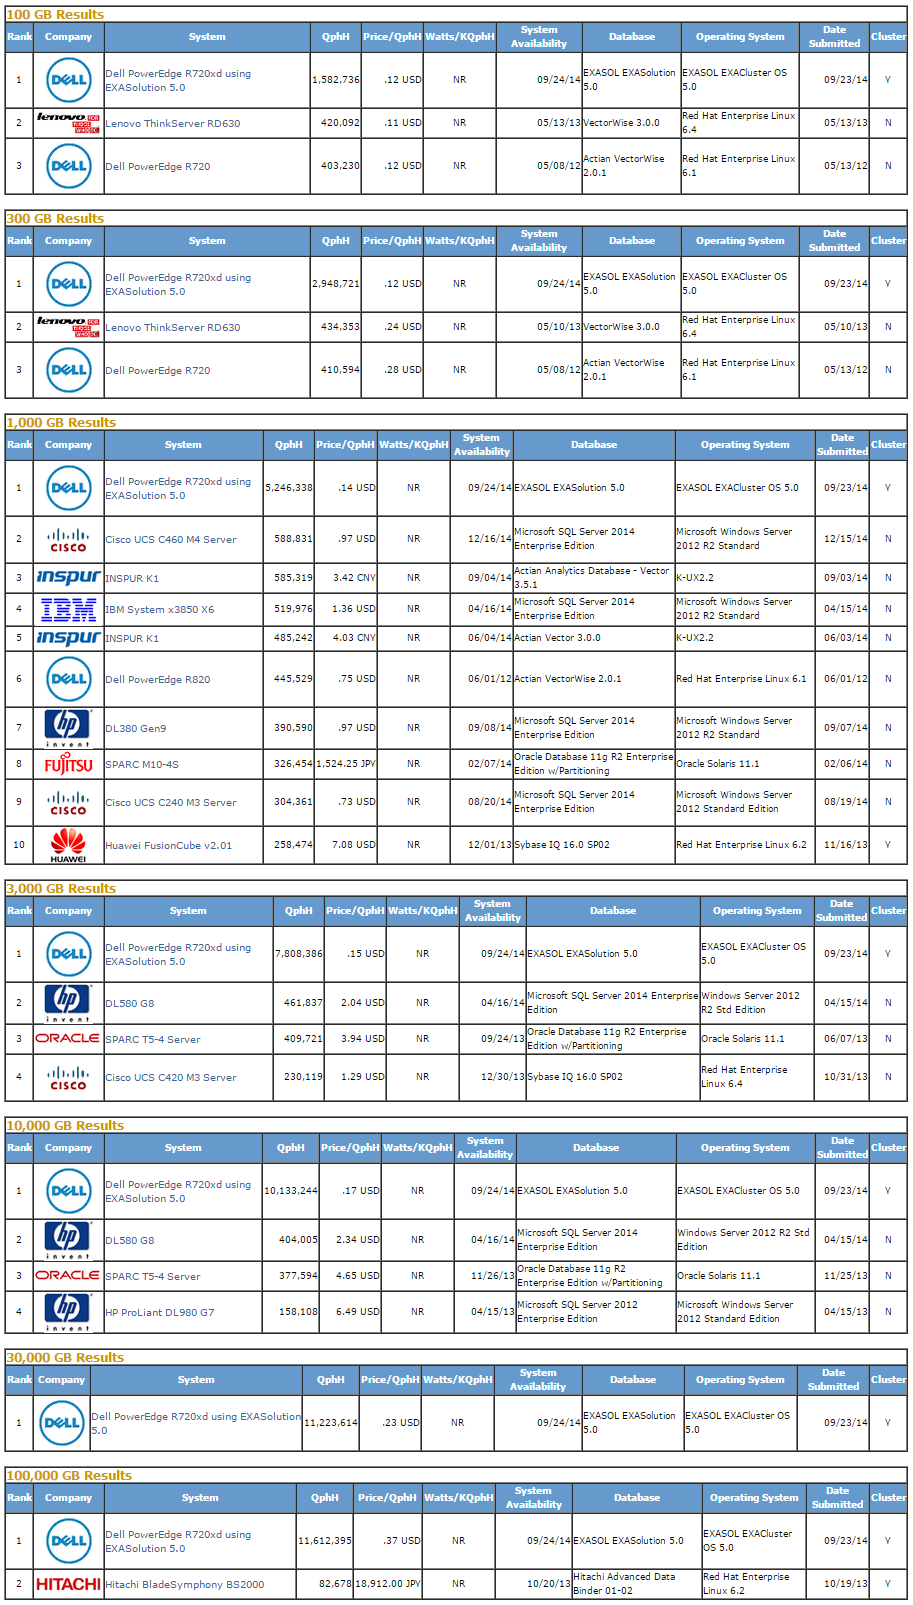
The TPC Benchmark™H (TPC-H) is a decision support benchmark. It consists of a suite of business oriented ad-hoc queries and concurrent data modifications. The queries and the data populating the database have been chosen to have broad industry-wide relevance. This benchmark illustrates decision support systems that examine large volumes of data, execute queries with a high degree of complexity, and give answers to critical business questions. The performance metric reported by TPC-H is called the TPC-H Composite Query-per-Hour Performance Metric (QphH@Size), and reflects multiple aspects of the capability of the system to process queries. These aspects include the selected database size against which the queries are executed, the query processing power when queries are submitted by a single stream, and the query throughput when queries are submitted by multiple concurrent users. The TPC-H Price/Performance metric is expressed as $/QphH@Size.
Current (18 March, 2015) top TPC-H performers are as per the screenshot below.
Storage
Properly configured storage, another key component of deploying a robust SQL Server infrastructure, can have a drastic impact on how you database performs. There is a multitude of factors to consider e.g. budget, server usage, your existing hardware, performance expectations etc. but the first one to consider should be the expected workload type. As discussed in PART 1 of this series, SQL Server can perform a few different types of workloads e.g. OLTP, DW/DSS, OLAP or a mixture of those. These workloads have different I/O access patterns and the choices in storage should reflect those. Here are some of the most common storage activities and characteristics performed by the database that reflect those.
- OLTP workloads – have frequent writes to data files and log files as well as frequent random reads from data files if the database does not fit into memory.
- DW/DSS workloads – large sequential read from data files.
- OLAP workloads – frequent, random reads from cubes.
SQL Server can be typically deployed onto five different types of storage which as was the case with the workload types, will affect performance levels. These are:
- Internal drives – your traditional magnetic drives or more modern solid state drives (SSDs)
- PCI-E storage cards
- Storage Area Network (SAN)
- Direct-attached storage
- Server message block (SMB) file shares (Windows Server 2012 and higher)
Nevertheless, storage type is not the only culprit of poor storage-related performance issues. These can also come from RAID level that the disks have been provisioned with, number of disks, disk speed e.g. 10K drives or 15K drives, bandwidth of the RAID controller and many more so it’s important to not only look at the storage medium type but also at the extra features it carries and how it has been provisioned/configured. The following ’10 commandments’ typically apply to a holistic storage configuration for SQL Server.
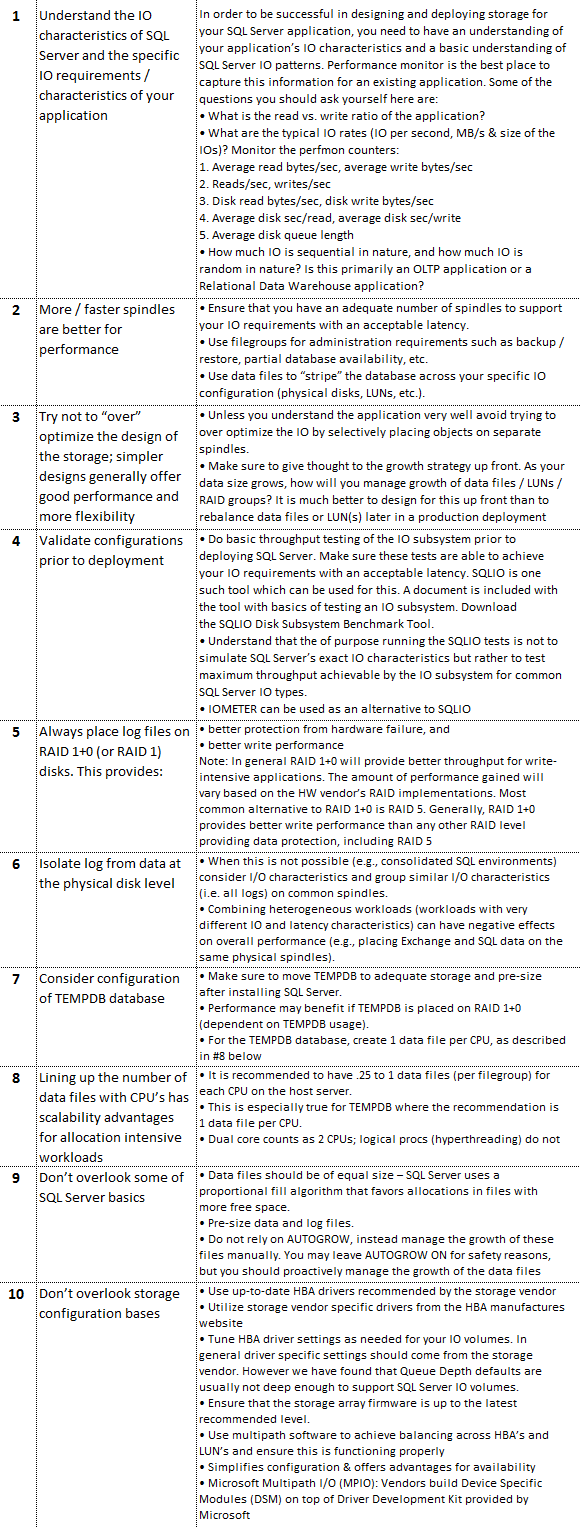
Event though the above applies to storage configuration in general, regardless of whether the workload targets OLTP or DW/DSS environments, data warehouse systems rely heavily on storage access speed as the copious volumes of data cannot be cached in memory. Selecting the fastest storage medium and configuration with the best sequential read speed e.g. PCI-E cards in RAID1 array will provide a significant performance boost. If PCI-E card(s) cost is considered prohibitive, solid state drives can deliver much better performance over magnetic disk drives on a budget whilst including simplified management, lower operational costs, and predictable maintenance. The following advantages typically characterize SSD storage and its choice over magnetic disk drives.
- Simplified management – Solid state storage does not require fragmentation management. The SQL Server startup option –E should still be used, but no further optimization or management of page allocation is required. This simplification makes long-term management of FTDW environments significantly easier. In addition, larger disk groups and lower volume/LUN counts can be used with no negative performance implications. This change simplifies filegroup creation and maintenance.
- I/O resiliency – Solid state storage has minimal performance degradation under high concurrency or page fragmentation. In addition, mixed random read (seek) workload does not negatively impact large request (scan) I/O patterns.
- Predictable maintenance – Many solid-state storage options provide software based write-life monitoring with lower frequency of difficult-to-predict physical failures.
- Lower operational cost – While more expensive at list-price, solid-state storage offers a more efficient balance of I/O throughput to capacity per unit. Effective FTDW workload I/O rates for 300 GB 10k SAS HDD average 50 MBs. Enterprise MLC SSD delivers between 150 and 200 MBs at 600-GB capacity. Additionally, solid-state storage draws significantly less power, generates less heat, and often supports higher density solutions.
Additional to the storage configuration guidelines outline above, the following adjustments can be employed to maximise DW/DSS performance when coupled with a solid state drives for primary data storage.
- If mirroring is required, RAID1+0 or RAID5 can be used. RAID5 provides the best capacity at no performance penalty for FTDW workloads on solid state.
- LUN and volume count can be reduced to as low as one PRI volume per storage unit. It is helpful in some cases to have the PRI volume count be a multiple of the CPU core count. The minimum PRI volume count is two.
- The transaction log can be placed on solid state as well, but FTDW workloads are not typically log-bound. Cost can be reduced by placing the log on traditional HDD. The same is true of local storage for Windows Server and SQL Server installation.
- Recommendations for page fragmentation management and cluster index parallel loading can be ignored, because logical database fragmentation does not impact solid stage I/O performance.
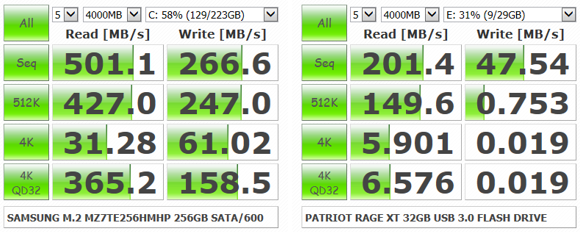
In order to evaluate the existing storage performance or to approximate the requirements for the storage system that would resolve the most common storage-related issues i.e. low IOPS and throughput and high latency, there is a number of tools that can be used to facilitate this analysis. The most common ones are SQLIO from Microsoft and CrystalDiskMark, both free. The latter one can be downloaded as a portable edition (no installation required) from HERE and the rest is very simple as the interface is simple and intuitive. CrystalDiskMark generates sequential & random, read & write loads at your storage system in 512KB and 4KB chunks. This gets you quick answers, but not necessarily SQL Server-related – after all, SQL Server doesn’t read or write in 512KB or 4KB chunks. Nevertheless, this tool is a quick and straightforward way to get a glimpse into your storage throughput capabilities as per the images below (samples from my Samsung M.2 SATA/600 SSD and Patriot Rage XT USB 3.0 flash drive for comparison)
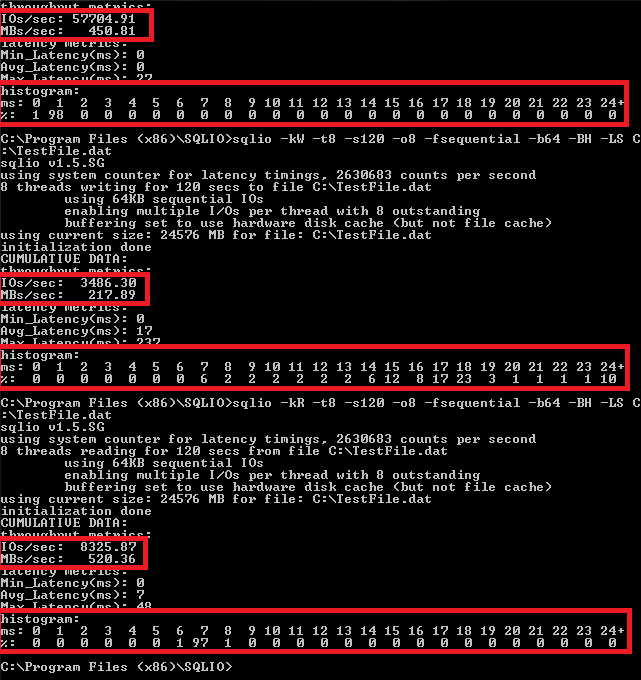
SQLIO, on the other hand, is a little more comprehensive tool that even though has nothing to do with SQL Server (as the name may imply), it supports a large number of options and provides a more comprehensive view of the storage subsystem. Brent Ozar’s blog and THIS POST has a good overview on getting started with using SQLIO so I will not go into details here but even though the tool has no GUI (most of testing is done in the command line), don’t let that scare you off – with a little bit of notepad magic and Google the implementation is very straightforward. Below is the output of my laptop’s storage (single Samsung M.2 SSD in Lenovo T440s) performance test using SQLIO with core performance measures highlighted.
Memory
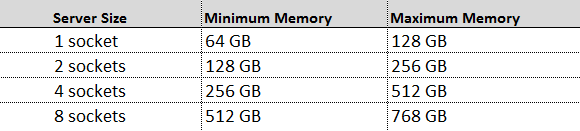
SQL Server memory upgrade/selection is probably the cheapest way to boost its performance e.g. at the time of writing this post Amazon had a 128GB of DDR3 memory available for around 1,500 dollars which compared to the price of SQL Server licence or changing an application code seem like a rounding error. For DW/DSS systems, in their Fast Track Data Warehouse Reference Guide (SQL Server 2012) Microsoft recommends a minimum of 64GB for a single-socket server which grows linearly with the socket counts available in the system e.g. two-socket server – 128GB, four-socket server – 256GB etc. For maximum memory recommendation, doubling the minimum is a good estimate as per table below.
The following considerations are also important to bear in mind when evaluating system memory requirements:
- Query from cache – Workloads that service a large percentage of queries from cache may see an overall benefit from increased RAM allocations as the workload grows.
- Hash joins and sorts – Queries that rely on large-scale hash joins or perform large-scale sorting operations will benefit from large amounts of physical memory. With smaller memory, these operations spill to disk and heavily utilise tempdb, which introduces a random I/O pattern across the data drives on the server.
- Loads – Bulk inserts can also introduce sorting operations that utilise tempdb if they cannot be processed in available memory.
- xVelocity memory-optimized columnstore index – Workloads that heavily favor columnstore index query plans run more efficiently with memory pools at the higher end of the ranges listed in the table above.
Naturally these recommendations will need to be reconciled against the SQL Server edition you plan on running as different versions have different limitations on the amount of memory used by the database engine or other SQL Server components (see PART 1 for specifics) e.g. SQL Server Standard Edition (2014 version) allows up to 128GB for database engine and additional 64GB for SASS and SSRS.
When it comes to OLTP workloads, the general rule of thumb is that as long as the database (including indexes) fits into memory, than the performance should be adequate, however, when sizing memory for a new server more is always better. If using Standard or BI Edition (SQL Server 2014), allocating as much memory as the licence permits i.e. 128GB for database engine is a good practice. When running SSAS or/and SSAS on the same server Microsoft allows addition 64GB for Standard Edition and as much as the OS can take for the BI equivalent. Things get a little tricky when dealing with Enterprise Edition where, in theory, you can allocate as much as 4TB of RAM for a single instance if running on Windows Server 2012 and higher. If unsure what the adequate size should be buy as much as possible, otherwise running a number of tests and evaluating system performance in view of memory usage should shed some light on the actual requirements and at what point your memory is under strain.
One of the best places to start conducting capacity planning by measuring performance statistics is Performance Monitor, otherwise known as Perfmon. Perfmon allows measuring various performance statistics on a regular interval, and saving the results into a file for further analysis. The database administrator picks the time interval, file format, and which statistics are monitored. SQL Server provides numerous counters for monitoring and evaluating performance of your system. Although there are no hard and fast rules for performance monitoring, you should audit your system periodically to ensure that it lives up to user expectations. The first step in performance monitoring efforts should be collecting baseline information. A baseline has a collection of performance counter values while the system isn’t heavily utilised and performs well. Next you should take benchmarks at various times of day and during different days of week to figure out acceptable ranges for the performance counters you intend to monitor. For example, your tests could reveal that buffer cache hit ratio values between 93.5% and higher are acceptable, but any value below 93.5% indicates sub-optimal performance. Then setup continuous monitoring and define alerts which notify you if any performance counter values fall below (or rise above) a predefined threshold. Although we try to provide some guidelines for performance counter values adequate range for each counter will vary from one environment to next; this is why it’s important to create a baseline and determine acceptable values for each counter. You should watch several memory related counters very closely as they present a clear indication of acceptable or sub-optimal performance.
A large majority of these memory performance counters are available through Memory Manager, Plan Cache and Buffer Manager objects with their associated counters as per table below.
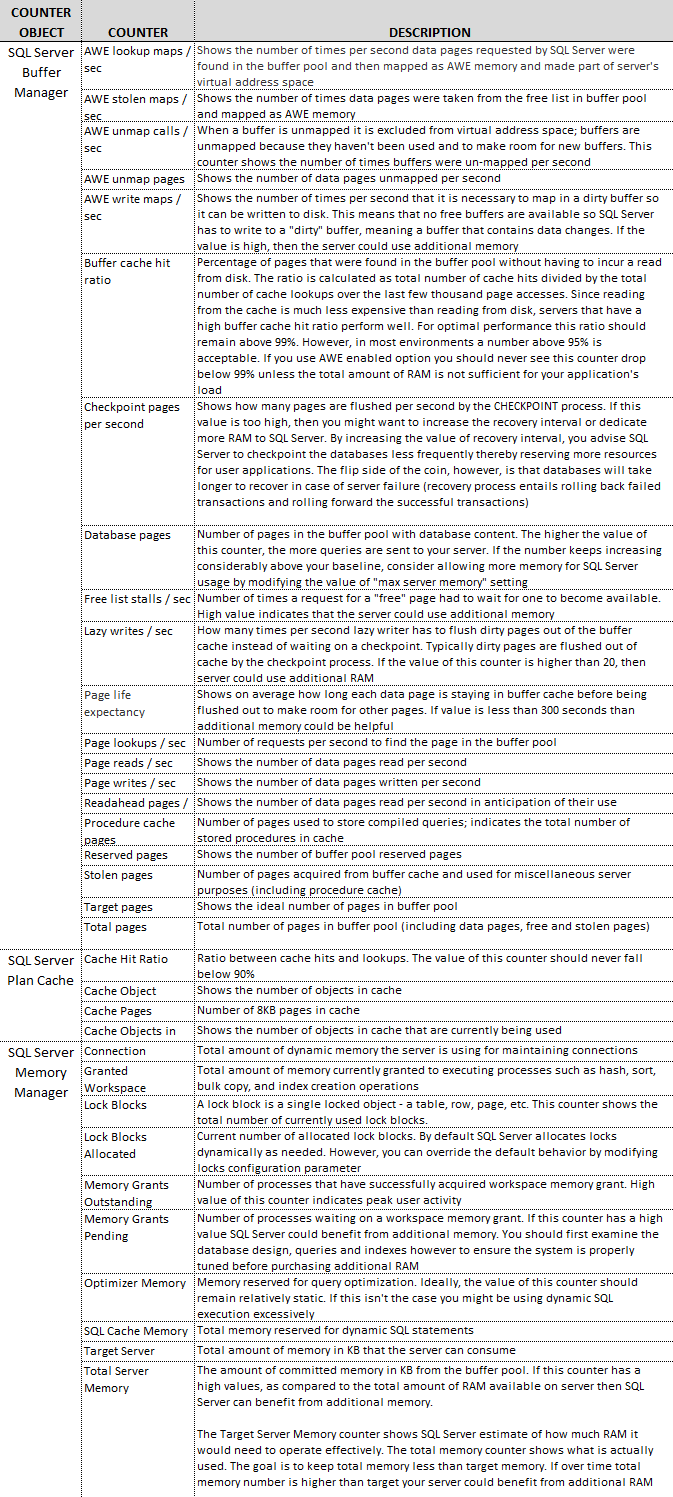
Quest Software also released a handy poster which provides description of key Windows/SQL Perfmon counters with their recommended target values (you can download it from HERE).
Another factor to consider is the effect of different memory configurations on the memory bandwidth of the memory. As you add more DIMMs to a system to populate more of the available memory slots, the bandwidth of the memory can decrease, which can hurt memory access performance somewhat. This effect varies based on the processor and the associated, integrated memory controller that is being used. The latest Intel processors are much less susceptible to this problem. Regardless of this, I still favor using large amounts of RAM, because even ‘slower’ RAM is in order of magnitude faster than your storage subsystem. If you are concerned about this, you should consult the documentation for your server to see the recommendations for how you should configure your memory.
Conclusion
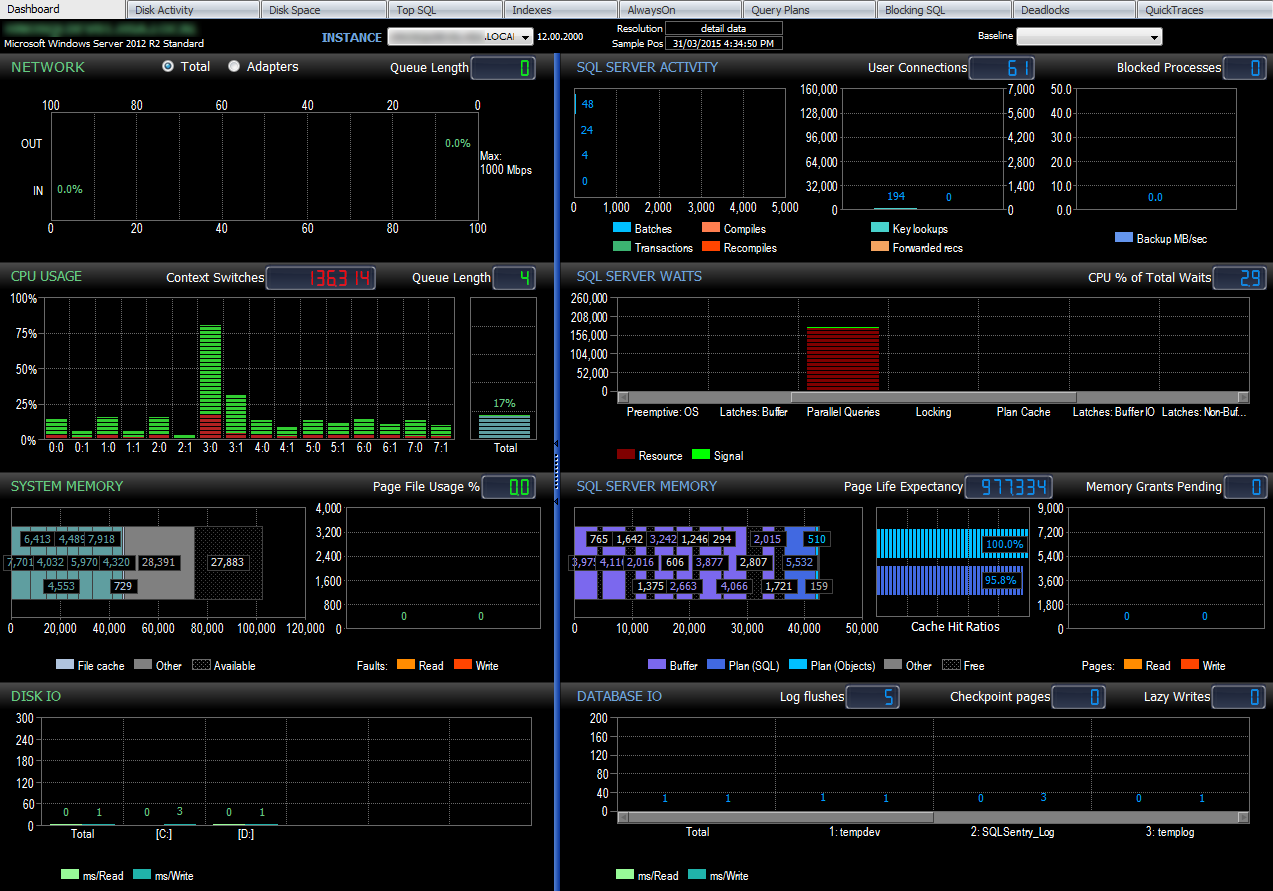
This concludes the second post in this series. The information outlined in these two installments provides a rudimentary ‘check list’ of the core functions that typically require investigating when making a decision on provisioning/procuring a new hardware for SQL Server installation and usually a much more comprehensive approach needs to be taken when evaluating future needs. When faced with an infrastructure upgrade an experienced DBA will carefully establish performance baselines and determine the production capacity needed by an organisation/application to meet current and future demands. Some tools which may assist in capacity planning have already been listed above and typically provide a single point of focus in regards to various pressure points when dealing with different realms of hardware upgrade/update. Sometimes it may be beneficial to use a more comprehensive tooling which gives the administrator more holistic view of system’s performance e.g. SQL Sentry Performance Advisor or Database Performance Analyser. A full-featured trial version of any of these applications can usually be downloaded, installed and evaluated for a period of time so having the ability to view, troubleshoot and report on the system core components’ performance levels can be a great asset and speed up the analysis phase. Below is a screenshot of SQL Sentry Performance Advisor activity dashboard for one of the SQL Server instances (click on image to expand).
Regardless of which tool you use to ascertain your performance needs, every SQL Server hardware selection decision, particularly when deploying a new server, should be preceded with a detailed analysis of all the core components making up the platform, not only from the hardware point of view but also factoring in licensing model and projected workload type. There is a lot to take into consideration but a little bit of elbow-grease, backed up by some investigative work and the consideration for best practice guidelines should yield a great performing system with no unexpected or costly surprises.
http://scuttle.org/bookmarks.php/pass?action=addThis entry was posted on Thursday, October 2nd, 2014 at 1:52 am and is filed under SQL Server. You can follow any responses to this entry through the RSS 2.0 feed. You can leave a response, or trackback from your own site.


Hello Kind of what I've been looking for - thanks for posting. I don't use Snowflake but gives me an…