SharePoint Integrated Mode Pesky Images Rendering in SSRS
Recently I have been busy creating a series of dashboard reports for one of the clients. As the reports are to be integrated into a custom, in-house developed web portal, the report server needed to be installed in the SharePoint integrated Mode (SharePoint 2010). As the application backend is based on SQL Server 2008 R2 and the core functionality has been developed in .NET, SSRS was easy to integrate using ReportViewer webpart. Majority of the reports use stored procedure to fetch data from tables, which already contain pre-aggregated data (between 300 and 1200 rows and approximately 10 columns).
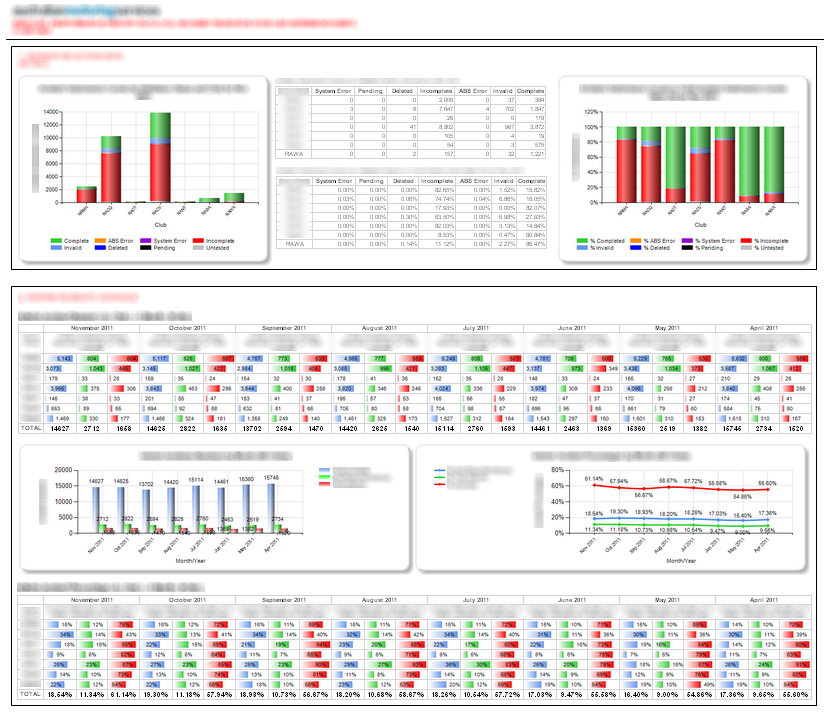
Most of the reports perform very well, with the execution times ranging from 900 milliseconds to 2 seconds. The exception to this rule consist of a batch of reports which contain visually rich elements e.g. charts and gauges embedded within a matrix. Quick, back-of-the-napkin calculation of the number of images to display (8 x 3 x 7) by two matrix objects, this gives us 336 images to render each time the report is run.
Also, since the images are being created dynamically by SSRS, they are given a unique identifier which is not cached – so the end result may be the same image that is already displayed multiple times. Given the fact that all these are relatively small in size – under 1KB – and that rendering takes advantage of a pretty gutsy backend hardware you can imagine how unimpressed I was when the report took 48 seconds to fully display. Also, majority of those will be run by the client’s customers over WAN spread out all over the country so there is an extra cost associated with traversing the Internet, not just our LAN. Below is a short screen capture footage displaying the report’s unacceptable execution speed.
According to Microsoft, in SP Integrated Mode, there are a lot more WFE API calls, as well as WFE-SSRS API calls. These contribute to the overall rendering time, which we later confirmed by running a trace using WireShark as well as in-browser Google Developer Tools. Below are the screen captures from GDT run in Chrome depicting the size of the images loaded as well as the final call for image after nearly 44 seconds of blocking due to the synchronous execution nature of the transfer.
Running same reports in Native Mode the performance was respectable and easily allied to the client KPIs and SLAs. As far as I’m aware there is no fixes or improvements in this realm released from Microsoft, even though they are aware of the issue. SQL Server 2012 (codename Denali) is supposed to have major improvements in this area but if you installed or recently upgraded to version 2008 (R2), you’re out of luck. There are even some BI departments I ‘m aware of that withheld their upgrades from version 2005 due to the impact this issue would have on their reporting standards.
http://scuttle.org/bookmarks.php/pass?action=addThis entry was posted on Monday, April 2nd, 2012 at 11:59 am and is filed under SharePoint, SSRS. You can follow any responses to this entry through the RSS 2.0 feed. You can leave a response, or trackback from your own site.


