November 1st, 2013 / No Comments » / by admin
Background And Environment Specs Recap
In the FIRST part of this series I briefly explored the background of Amazon’s Redshift data warehouse offering as well as outlined the environments and tools used for managing test datasets. I also recreated TICKIT database schema on all instances provisioned for testing and preloaded them with dummy data. In this post I would like to explore the performance findings from running a bunch of sample SQL queries to find out how they behave under load. Final post outlining how to connect and use data stored in Redshift can be found HERE.
As mentioned in my FIRST post, all datasets which populated TICKIT sample database were quite small so I needed to synthetically expand one of the tables in order to increase data volumes to make the whole exercise viable. Using nothing but SQL I ‘stretched out’ my Sales fact table to around 50,000,000 records which is hardly enough for any database to break a sweat, but given the free storage limit on Amazon S3 is only 5 GB (you can also use DynamoDB as a file storage) and that my home internet bandwidth is still stuck on ADSL2 I had to get a little creative with the SQL queries rather than try to push for higher data volumes. Testing methodology was quite simple here – using mocked-up SQL SELECT statements, for each query executed I recorded execution time on all environments and plucked them into a graph for comparison. None of those statements represent any business function so I did not focus on any specific output or result; the idea was to simply make them run and wait until completion, taking note of how long it took from beginning to end. Each time the query was executed, the instance got restarted to ensure cold cache and full system resources available to database engine. I also tried to make my SQL as generic as possible. By default, SQL is not a very verbose language, with a not a lot of dichotomies between different vendors. Most of the core syntax principles apply to both PG/SQL and Microsoft T-SQL alike. However, there are some small distinctions which can get ‘lost in translation’ therefore I tried to keep the queries are as generic and universal as possible.
As far as physical infrastructure composition, the image below contains a quick recap of the testing environment used for this evaluation. Initially, I planned to test my queries on 3 different Redshift deployments – a single and a multi-node Redshift XL instance as well as a single Redshift 8XL instance, however, after casually running a few queries and seeing the performance level Redshift is capable of I decided to scale back and run only with Redshift XL class in a single and multi-node configurations.
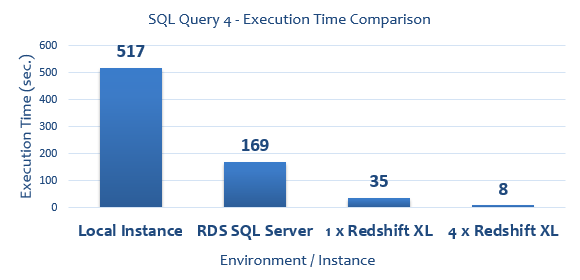
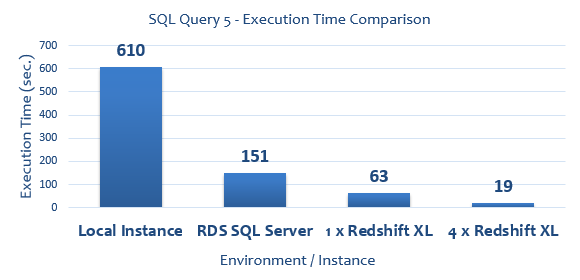
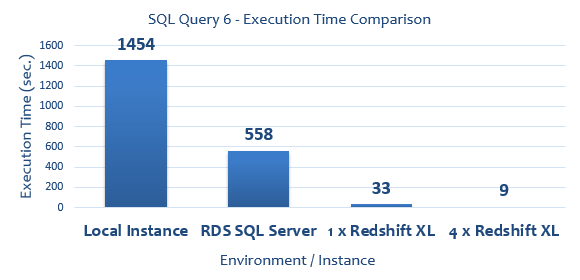
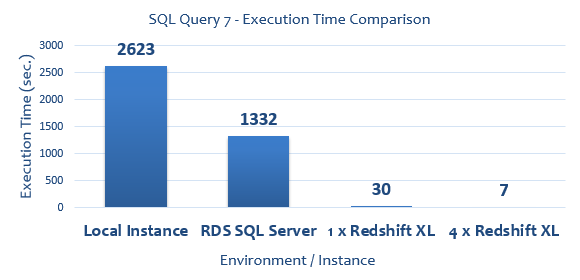
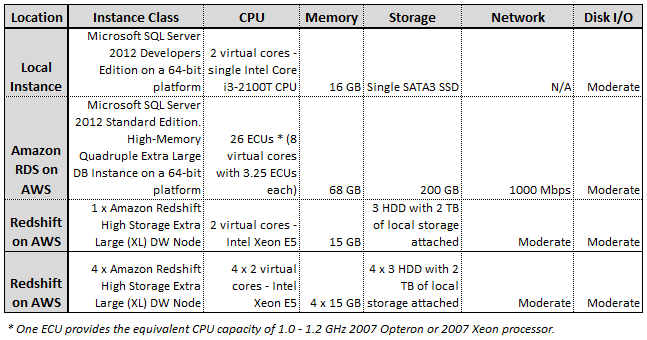 Graphing the results, for simplicity sake, I assigned the following monikers to each environment:
- ‘Local Instance’ – my local SQL Server 2012 deployment
- ‘RDS SQL Server’ – High-Memory Quadruple Extra Large DB Instance of SQL Server 2012
- ‘1 x Redshift XL’ – Single High Storage Extra Large (XL) Redshift DW node (1 x dw.hs1.xlarge)
- ‘4 x Redshift XL’ – Four High Storage Extra Large (XL) Redshift DW nodes (4 x dw.hs1.xlarge)
Test Results
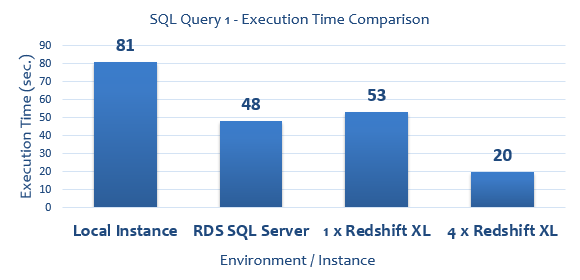
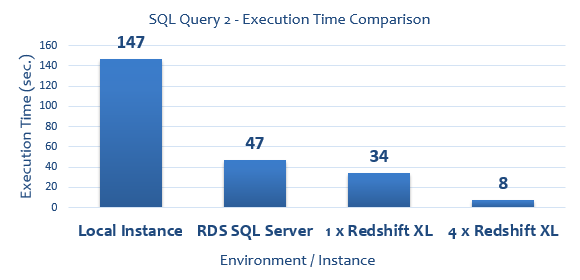
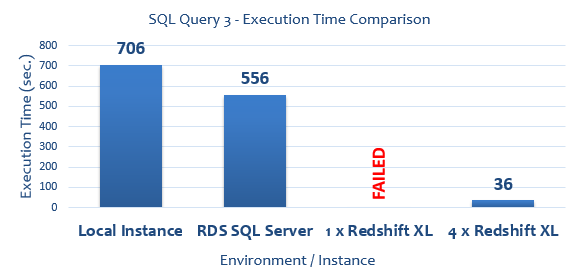
All SQL queries run to collect execution times (expressed in seconds) as well as graphical representation of their duration are as per below.
--QUERY 1
SELECT COUNT(*) FROM
	(SELECT COUNT(*) AS counts, salesid, listid, sellerid, buyerid,
	eventid, dateid, qtysold, pricepaid, commission, saletime
	FROM sales
	GROUP BY salesid, listid, sellerid, buyerid, eventid,
	dateid, qtysold, pricepaid, commission, saletime) sub
--QUERY 2
WITH cte AS (
	SELECT
		SUM(s.pricepaid) AS pricepaid,
		sub.*,
		u1.email,
		DENSE_RANK() OVER (PARTITION BY sub.totalprice ORDER BY d.caldate DESC) AS daterank
	FROM sales s  JOIN
		(SELECT l.totalprice, l.listid, v.venuecity, c.catdesc
		FROM listing l
		LEFT JOIN event e on l.eventid = e.eventid
		INNER JOIN category c on e.catid = c.catid
		INNER JOIN venue v on e.venueid = v.venueid
		GROUP BY v.venuecity, c.catdesc, l.listid, l.totalprice) sub
	ON s.listid = sub.listid
	LEFT JOIN users u1 on s.buyerid = u1.userid
	LEFT JOIN Date d on d.dateid = s.dateid
	GROUP BY sub.totalprice, sub.listid, sub.venuecity, sub.catdesc, u1.email, d.caldate)
SELECT COUNT(*) FROM cte
--QUERY 3
SELECT COUNT(*) FROM(
SELECT s.*, u.* FROM sales s
		LEFT JOIN event e on s.eventid = e.eventid
		LEFT JOIN date d on d.dateid = s.dateid
		LEFT JOIN users u on u.userid = s.buyerid
		LEFT JOIN listing l on l.listid = s.listid
		LEFT JOIN category c on c.catid = e.catid
		LEFT JOIN venue v on v.venueid = e.venueid
	INTERSECT
SELECT s.*, u.* FROM sales s
		LEFT JOIN event e on s.eventid = e.eventid
		LEFT JOIN date d on d.dateid = s.dateid
		LEFT JOIN users u on u.userid = s.buyerid
		LEFT JOIN listing l on l.listid = s.listid
		LEFT JOIN category c on c.catid = e.catid
		LEFT JOIN venue v on v.venueid = e.venueid
		WHERE d.holiday =0) sub
--QUERY 4
WITH Temp (eventname, starttime, eventid) AS
	(SELECT ev.eventname, ev.starttime, ev.eventid
	FROM Event ev
	WHERE	NOT EXISTS
			(SELECT 1 FROM Sales s
			WHERE s.pricepaid  > 500 AND s.pricepaid < 900 AND s.eventid = ev.eventid)
			AND  EXISTS	(SELECT 1 FROM Sales s
			WHERE s.qtysold  >= 4 AND s.eventid = ev.eventid))
SELECT COUNT(t.eventid) AS EvCount,
SUM(l.totalprice)  - SUM((CAST(l.numtickets AS Decimal(8,2)) * l.priceperticket * 0.9)) as TaxPaid
FROM Temp t JOIN Listing l ON l.eventid = t.eventid
WHERE t.starttime <= l.listtime
--QUERY 5
SELECT COUNT(*) FROM
	(SELECT
		SUM(sub1.pricepaid) AS price_paid,
		sub1.caldate AS date,
		sub1.username
	FROM
		(select  s.pricepaid, d.caldate, u.username
		FROM Sales s
		LEFT JOIN date d on s.dateid=s.dateid
		LEFT JOIN users u on s.buyerid = u.userid
		WHERE s.saletime BETWEEN '2008-12-01' AND '2008-12-31'
		) sub1
	GROUP BY sub1.caldate, sub1.username
	) as sub2
--QUERY 6
WITH CTE1 (c1) AS
		(SELECT COUNT(1) as c1 FROM Sales s
		WHERE saletime BETWEEN '2008-12-01' AND '2008-12-31'
		GROUP BY salesid
		HAVING COUNT(*)=1),
	CTE2 (c2) AS
		(SELECT COUNT(1) as c2 FROM Listing e
		WHERE listtime BETWEEN '2008-12-01' AND '2008-12-31'
		GROUP BY listid
		HAVING COUNT(*)=1),
	CTE3 (c3) AS
		(SELECT COUNT(1) as c3 FROM Date d
		GROUP BY dateid
		HAVING COUNT(*)=1)
SELECT COUNT(*) FROM Cte1
					RIGHT JOIN CTE2 ON CTE1.c1 <> CTE2.c2
					RIGHT JOIN CTE3 ON CTE3.c3 = CTE2.c2 and CTE3.c3 <> CTE1.c1
					GROUP BY CTE1.c1
					HAVING COUNT(*)>1
--QUERY 7
SELECT COUNT(*) FROM
(SELECT COUNT(*) as c FROM sales s
WHERE s.saletime BETWEEN '2008-12-01' AND '2008-12-31'
GROUP BY salesid
HAVING COUNT(*)=1) a
LEFT JOIN
(SELECT COUNT(*) as c FROM date d
WHERE d.week = 1
GROUP BY dateid
HAVING COUNT(*)=1) b
ON a.c <> b.c
LEFT JOIN
(SELECT COUNT(*) as c FROM listing l
WHERE l.listtime BETWEEN '2008-12-01' AND '2008-12-31'
GROUP BY listid
HAVING COUNT(*)=1) c
ON a.c <> c.c AND b.c <> c.c
LEFT JOIN
(SELECT COUNT(*) as c FROM venue v
GROUP BY venueid
HAVING COUNT(*)=1) d
ON a.c <> d.c AND b.c <> d.c AND c.c <> d.c
Finally, before diving into conclusion section, a short mention of a few unexpected hiccups along the way. On a single node deployment 2 queries failed for two different reasons. First one returned an error message stating that ‘This type of correlated subquery pattern is not supported yet’ (see image below).
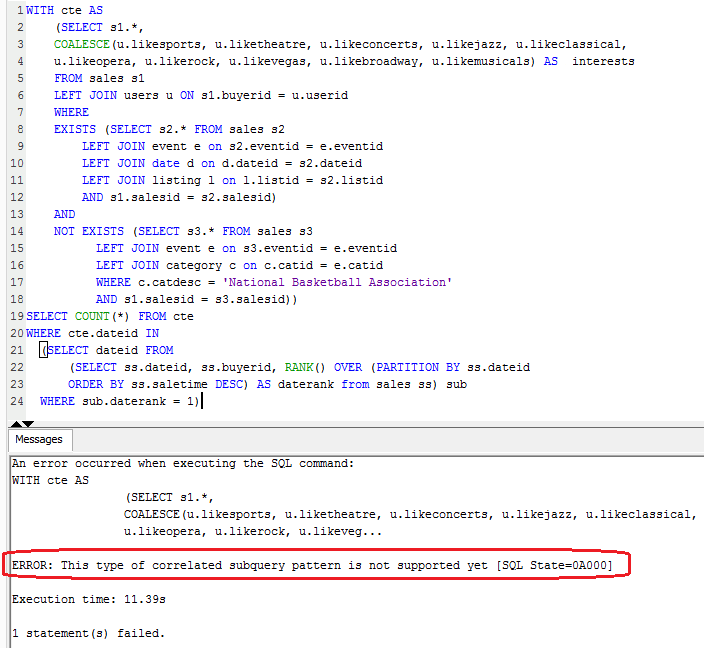
Because of this, I decided to remove this query from the overall results tally leaving me with 7 SQL statements for testing. Query 3 on the other hand failed with ‘Out of memory’ message on the client side and another cryptic error showing up in management console as per images below (click on image to enlarge).
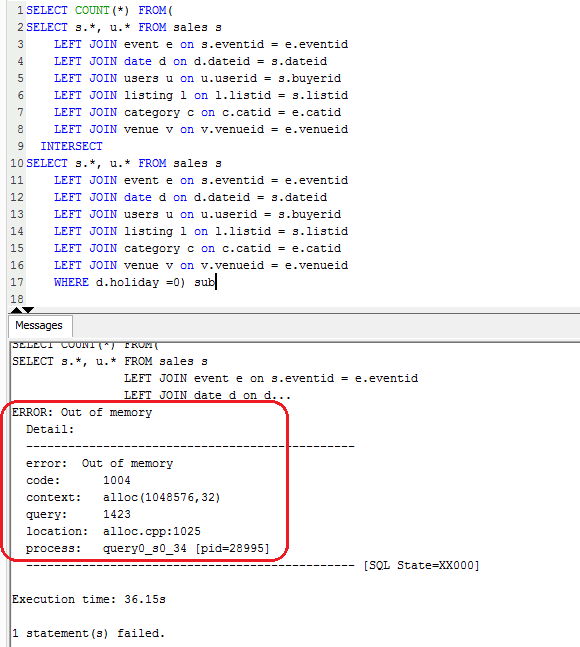

I think that inadequate memory allocation issue was due to the lack of resources provisioned as it only appeared when running on a single node – the multi-node deployment executed without issues. Nevertheless, it was disappointing to see Redshift not coping very well with memory allocation and management, especially given that same query run fine (albeit slow) on both of the SQL Server databases.
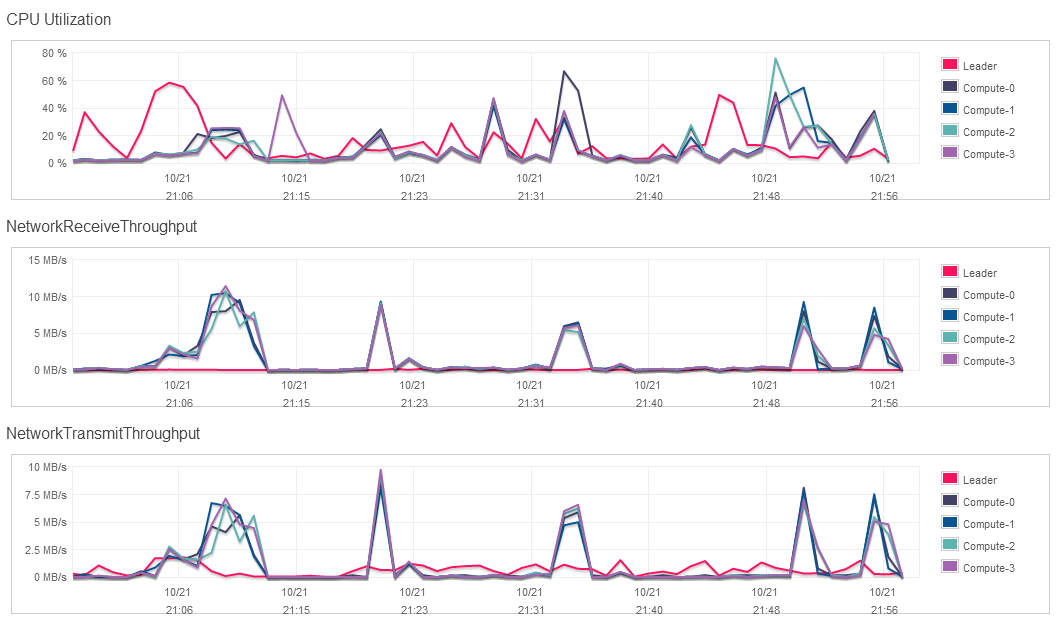
For reference, below is a resource consumption graph (3 parameters included) for the multi-node deployment of Amazon Redshift during queries execution.
Performance Verdict
I don’t think I have to interpret the results in much detail here – they are pretty much self-explanatory. Redshift, with the exception of few quibbles where SQL query was either unsupported or too much to handle for its default memory management, completely outrun the opposition. As I already stated in PART 1 of this series, relational database setup is probably not the best option for reading vast volumes of data with heavy aggregations thrown into the mix (that’s what SSAS is for when using Microsoft as a vendor) but at the same time I never expected such blazing performance (per dollar) from the Amazon offering. At this point I wish I had more data to throw at it as 50,000,000 records in my largest table is not really MPP database playground but nevertheless, Redshift screamed through what a gutsy SQL Server RDS deployment costing more completely chocked on. Quite impressive, although having heard other people’s comments and opinions, some even going as far as saying that Redshift is a great alternative to Hadoop (providing data being structured and homogeneous), I was not surprised.
In the next part to this series – PART 3 – I will be looking at connecting to Redshift database using some popular reporting/data visualization tools e.g. Tableau too see if this technology makes it a viable backend solution not just for data storage but also for querying through third-party applications.
Posted in: Cloud Computing
Tags: Amazon Redshift, Big Data, Cloud Computing, MPP RDBMS, SQL Server
October 31st, 2013 / No Comments » / by admin
Introduction
It had to happen eventually! Given the formidable industry push to put everything into the cloud, data warehousing technologies are also slowly succumbing to this trend. Enter Amazon Redshift. Since the inception of various different PaaS (Platform-as-a-Service) providers such as Microsoft Azure and Amazon Web Services, anyone could run transactional database in the cloud. However, maybe with the exception of Big Data, the trend so far has indicated that most companies would prefer on-premise, locally hosted or operated data warehouse set up. Partially due to privacy concerns but mostly as a result of cost-saving policies and lack of adequate support, data warehouses and analytical platforms, until recently, were not typically associated with cloud deployments. I have been in Business Intelligence for nearly 10 years now and even if given free rein to choose a platform and technology of my liking, I would be hard-pressed to contemplate, not to mention recommend a production-ready cloud based data warehouse solution, even if stakeholders’ requirements favored such approach. Although this status quo has had its valid merits in most cases (especially in light of latest discoveries regarding NSA data snooping and retention), more opportunities and therefore choices start to emerge. Just as IT leaders were not long ago equally scared to virtualise their infrastructure (today’s mantra – if you’re not virtualising, you’re doing it wrong), cloud based data warehousing will also need to undergo a paradigm shift and Amazon is first cab off the rank.
In this three part series (part two and three can be accessed HERE and HERE) I will be briefly describing the Amazon Redshift functionality in view of processes I used to load the data into Redshift, some of the performance findings from running the SQL queries on Redshift versus a couple of other environments and analytical/reporting applications connectivity to see if this technology, from my perspective, has a potential to become a tectonic shift in the data warehouse realm. Testing conducted will mainly focus on query execution speed but my main interest lies in analyzing the overall data processing capabilities so that my impression depends on the sum of all factors rather than one functionality at which Redshift excels in e.g. speed or cost.
Please note that data warehouse set up is a very complex exercise where a multitude of factors need to be taken into consideration. Simply measuring query execution performance in isolation should not be a deciding factor in whether any particular vendor or technology would be more or less suitable for deployment. Because a holistic and multi-facade approach coupled with comprehensive requirements analysis is a necessary prelude to determining which vendor offering is capable of delivering best ROI, this analysis barely scratches the surface of the long list of factors influencing such decision and should be only viewed in its isolated context. Also, data warehouse seasoned professionals reading this post may notice that Amazon Redshift and SQL Server (as per configuration used in this post) operate on two distinctively different architectures – Redshift is a MPP (massively-parallel processing) database based on PostgeSQL engine which uses columnar storage. SQL Server, on the other hand, is based on a standard implementation of a relational DBMS, not fully optimised for reading large volumes of data. Microsoft has got its own version of MPP appliance as well as columnar storage technology (since SQL Server version 2012), none of which are used in this evaluation. Also, if you are familiar with Microsoft BI suite, you will recognise that most large data warehouse deployments rely on storing and querying data from an OLAP engine (SSAS cubes or tabular, in-memory models) which are architecturally vastly different to this test setup. This gives Redshift an unfair advantage, however, the purpose was never to do a like-for-like comparison, rather to show off this new piece of technology while highlighting some of its features, one of those being query performance. Redshift is certainly not a panacea for every data storage related headache and has its own disadvantages e.g. in its current release it does not support user-defined functions, stored procedures, triggers, table functions, table partitioning, sequences etc. Compared to other vendors the out-of-the-box ability to extract, load and transform data is also limited although some key players in the ETL market are slowly catching up with upgrading their tools to include this functionality e.g. Informatica now provides Redshift integration. Finally, still in its BETA release, it may still be considered as too immature by some standards for a lot of businesses in order to take a leap of faith and jump on the hype-induced cloud bandwagon, effectively handing over the keys to their precious data empire to Amazon for safe keeping.
This is how Amazon itself describes the difference between RDS deployments and Redshift in one of their Q&A pages (link HERE).

With all the things considered, this rudimentary comparison is not intended to discredit other vendors – I still consider Microsoft as one of the best data warehousing technology experts in the world. My intent is simply to scratch the query execution performance surface and explore analytical/reporting applications connectivity options, out of my own curiosity, to better understand what Redshift is capable of, with all its pros and cons (more on this in the conclusion of PART 3 to this series). In the end, as previously mentioned, a robust BI platform does not solely depend on the query execution speed and other variables are just as important. Even though performance is what I focused on here, it is the collective feature richness (cost, connectivity, ease of use, support and maintenance overhead etc.) that will ultimately determine if the Redshift can present itself as a viable option to business interested in cloud data warehousing.
Amazon Redshift and Test Environments/Tools Overview
Amazon Redshift is a fast, fully managed, petabyte-scale data warehouse service which operates by utilizing columnar storage technology as well as parallelizing and distributing queries across multiple nodes. More specific information can be found on Amazon website so I will not get into detailed features overview in this post but Amazon is taunting this still beta release as a great solution for running optimised, scalable and most importantly cheap replacement for your locally hosted data warehouse. Cheap is the key word here. Amazon claims that on-demand Redshift XL Node which includes 2TB storage can be spun up for as low as 0.85 cents per hour. Quick back of the napkin calculation reveals that excluding data transfer over JDBC/ODBC and back up storage this equals to less than 8,000 a year. There are also 1-year and 3-year reserved instance pricing plans available which are even cheaper. What is more, Redshift does not deviate from using standard SQL and a plethora of existing BI tools so most administrators, analysts or developers should feel at home as no additional training overhead is involved.
Redshift test bed technical overview I will be running with as well as some rudimentary specifications for other environments I will be comparing it to are as per below.

I will also be using the following selection of tools or services to manage, access, query and display data:
- SQL Server 2012 Developers Edition (local instance) and Management Studio – Microsoft SQL Server database engine and development environment for managing both local and AWS RDS SQL Server instances
- SQL Manager for PostgreSQL – graphical tool for PostgreSQL Server administration and development. Lite version (Freeware) can be downloaded from HERE
- SQL Workbench/J – graphical tool for PostgreSQL Server administration and development. Can be downloaded from HERE
- JDBC driver – can be downloaded from HERE
- ODBC driver(s) – can be downloaded from HERE or HERE (64bit)
- Cloudberry Explorer for Amazon S3 – a freeware file manager for Amazon S3 and Amazon Glacier which can be downloaded from HERE
- Tableau 8.0 Professional Edition – rapid data visualization software. Trial edition can be downloaded from HERE
- Microsoft Office Professional Plus 2013 with Excel – spreadsheet application for data visualization and graphing
Redshift Data Loading
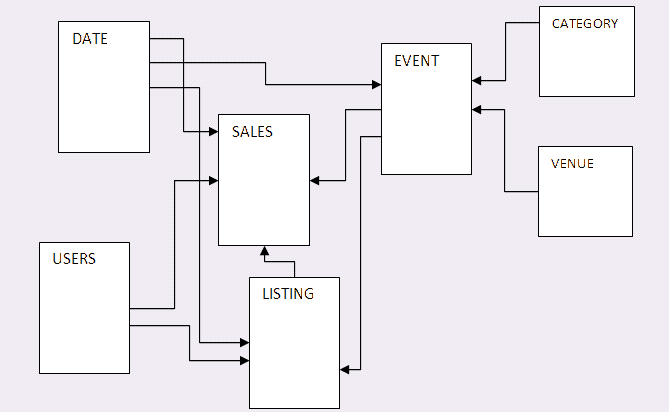
To get started with some sample data, I used Amazon’s own sample data warehouse schema for TICKIT database. Amazon provides the code to build all the tables as well as sample data stored as text files which can be accessed from S3 awssampledb, awssampledbuswest2 or awssampledbeuwest1 buckets in US East, West or Ireland regions correspondingly. The sample data warehouse schema looks as per below.
One of the ways to import these files into a local environment is to use an S3 file management utility and simply download/copy the files over. Below is a partial view of the tool (Cloudberry Explorer) used for S3 storage management with the publicly accessible bucket showing its content i.e. files I will be using for the purpose of this exercise.
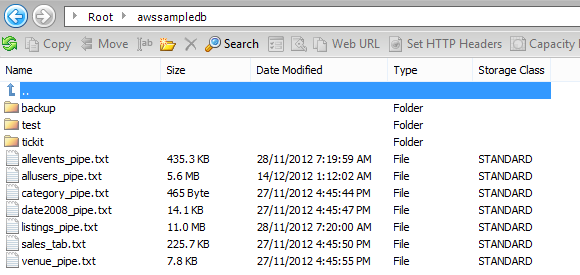
Looking at how the tables are structured and the data they hold I could tell that the volumes of data were kept to minimum – sales fact table, for example, had just over 3 thousands records in it. In order to make this testing-viable and make the most out of Redshift nodes I provisioned, I needed to have much more data. For this, I recreated the schema in my local Microsoft SQL Server instance and, expanded or, when you look closely, multiplied the data already available in the fact Sales table by the factor of around 16,000 using the following SQL (full script is available for download from HERE).
/*==============================================================================
									PART 4
==============================================================================*/

IF OBJECT_ID('tempdb..#Sales_Temp') IS NOT NULL
    DROP TABLE #Sales_Temp

CREATE TABLE #Sales_Temp(
	listid			INTEGER  not null,
	sellerid		INTEGER  not null,
	buyerid			INTEGER  not null,
	eventid			INTEGER  not null,
	dateid			SMALLINT not null,
	qtysold			SMALLINT not null,
	pricepaid		DECIMAL (8,2),
	commission		DECIMAL(8,2),
	saletime		DATETIME);

DECLARE @RowCount int = 0;
WHILE	@RowCount < 1000
	BEGIN
		SET NOCOUNT ON
		INSERT INTO dbo.#Sales_Temp
		(listid, sellerid, buyerid, eventid, dateid, qtysold, pricepaid, commission, saletime)
		SELECT
		(SELECT TOP 1 listid		FROM sales ORDER BY NEWID()),
		(SELECT TOP 1 sellerid		FROM sales ORDER BY NEWID()),
		(SELECT TOP 1 buyerid		FROM sales ORDER BY NEWID()),
		(SELECT TOP 1 eventid		FROM sales ORDER BY NEWID()),
		(SELECT TOP 1 dateid		FROM sales ORDER BY NEWID()),
		(SELECT TOP 1 qtysold		FROM sales ORDER BY NEWID()),
		(SELECT TOP 1 pricepaid		FROM sales ORDER BY NEWID()),
		(SELECT TOP 1 commission	FROM sales ORDER BY NEWID()),
		(SELECT TOP 1 saletime		FROM sales ORDER BY NEWID())
	SET @RowCount = @RowCount + 1
	END
GO

PRINT 'Extending dbo.Sales table commenced...'
GO
INSERT INTO dbo.Sales
(listid, sellerid, buyerid, eventid, dateid, qtysold, pricepaid, commission, saletime)
SELECT listid, sellerid, buyerid, eventid, dateid, qtysold, pricepaid, commission, saletime
FROM #Sales_Temp
GO 50000
That blew it out to around 50,000,000 sales records which is hardly enough for any database to break a sweat but given the free storage limit on Amazon S3 is only 5 GB (you can also use DynamoDB as a file storage) and that my home internet bandwidth is still stuck on ADSL2 I had to get a little creative with the SQL queries rather than try to push for higher data volume. Next, using the below SQL code, I partitioned my new Sales data into 10 roughly even files in order to upload those into my S3 bucket and proceeded to recreating TICKIT schema on my AWS RDS SQL Server instance.
/*==============================================================================
                                    PART 6
==============================================================================*/

/*
--To enable CMD_SHELL IF DISABLED
EXEC sp_configure 'show advanced options', 1
GO
RECONFIGURE
GO
EXEC sp_configure 'xp_cmdshell', 1
GO
RECONFIGURE
GO
*/

IF OBJECT_ID('tempdb..#Ids_Range') IS NOT NULL
    DROP TABLE #Ids_Range

CREATE TABLE #Ids_Range
(id INT IDENTITY (1,1),
range_from INT NOT NULL,
range_to INT NOT NULL)

DECLARE @R1 INT = 1
DECLARE @R2 INT = (SELECT MAX(salesid)/10 FROM dbo.Sales)
DECLARE @R3 INT = (SELECT MAX(salesid) FROM dbo.Sales)

INSERT INTO #Ids_Range
(range_FROM, range_to)
SELECT @R1, @R2             UNION ALL
SELECT @R2+1, @R2*2         UNION ALL
SELECT (@R2*2)+1, @R2*3     UNION ALL
SELECT (@R2*3)+1, @R2*4     UNION ALL
SELECT (@R2*4)+1, @R2*5     UNION ALL
SELECT (@R2*5)+1, @R2*6     UNION ALL
SELECT (@R2*6)+1, @R2*7     UNION ALL
SELECT (@R2*7)+1, @R2*8     UNION ALL
SELECT (@R2*8)+1, @R2*9     UNION ALL
SELECT (@R2*9)+1, @R3

PRINT '5. Files generation commenced...'
    DECLARE @z INT
    DECLARE db_cursor CURSOR
    FOR
    SELECT id FROM #ids_range
    OPEN db_cursor
    FETCH NEXT
    FROM db_cursor INTO @z
    WHILE @@FETCH_STATUS = 0
    BEGIN
        DECLARE
        @saveloc        VARCHAR(2048)
        ,@query         VARCHAR(2048)
        ,@bcpquery      VARCHAR(2048)
        ,@bcpconn       VARCHAR(64)
        ,@bcpdelim      VARCHAR(2)
        ,@range_FROM    INT = (SELECT range_FROM FROM #ids_range where id = @z)
        ,@range_to      INT = (SELECT range_to FROM #ids_range where id = @z)

        SET @query      = 'SELECT * FROM [Tickit_Extended_DB].[dbo].[Sales]'
        SET @query      = @query + 'WHERE salesid between '+cast(@range_FROM as varchar (20))+''
        SET @query      = @query + ' and  '+cast(@range_to as varchar(20))+' ORDER BY salesid asc'
        SET @saveloc    = 'c:\Tickit_Extended_DB_Files\NewSales.txt'
        SET @saveloc    = REPLACE(@saveloc, 'NewSales.txt', 'NewSales' +CAST(@z as varchar(2))+'.txt')
        SET @bcpdelim   = '|'
        SET @bcpconn    = '-T' -- Trusted
        --SET @bcpconn  = '-U <username> -P <password>' -- SQL authentication
        SET @bcpquery = 'bcp "' + replace(@query, char(10), '') + '" QUERYOUT "' + @saveloc + '" -c -t^' + @bcpdelim + ' ' + @bcpconn + ' -S ' + @@servername

		BEGIN TRY
			BEGIN TRANSACTION
				EXEC master..xp_cmdshell @bcpquery
			COMMIT TRANSACTION;
			PRINT 'File NewSales'+CAST (@z as varchar (2))+'.txt created sucessfully...'
		END TRY
		BEGIN CATCH
				SELECT
				 ERROR_NUMBER		() AS ErrorNumber
				,ERROR_SEVERITY		() AS ErrorSeverity
				,ERROR_STATE        () AS ErrorState
				,ERROR_PROCEDURE    () AS ErrorProcedure
				,ERROR_LINE         () AS ErrorLine
				,ERROR_MESSAGE      () AS ErrorMessage

				IF @@TRANCOUNT > 0
					ROLLBACK TRANSACTION;
		END CATCH

        FETCH NEXT
        FROM db_cursor INTO @z
    END
    CLOSE db_cursor
    DEALLOCATE db_cursor


IF OBJECT_ID('tempdb..#Ids_Range') IS NOT NULL
        BEGIN
            DROP TABLE #Ids_Range
        END
IF OBJECT_ID('tempdb..#Sales_Temp') IS NOT NULL
        BEGIN
            DROP TABLE #Sales_Temp
        END
The process of mirroring this environment on RDS was pretty much the same as recreating it in my local environment, just a little bit slower. As RDS does not permit to restore SQL Server database from a file, I could potentially migrate my local deployment using third party tools e.g. SQLAzure Migration Wizard application (although technically for Microsoft SQL Azure deployments, some users also reported successful migration to AWS RDS instances). I opted for a different approach. Given that moving 3 gigabytes of data (size of my local TICKIT database after expansion) was likely to take some time, I simply scripted out the initial TICKIT schema and data from my local environment and applied the same SQL code to ‘inflate’ my Sales fact table as I did before in my local environment.
All there was left to do was to create clustered indexes on all tables and finally, with my two SQL Server instances ticking along nicely, it was time to fire up Redshift. Spinning up a Redshift cluster is as easy as it gets especially with the help of ‘getting started’ tutorial which is available HERE. It also contains the details of how to copy the text files from S3 bucket, recreate sample database schema using SQL and the client tools selection for connecting to Redshift. For most of my experimentations with Redshift I tend to use SQL Manager for PostgreSQL, however, for this demo I stuck with Amazon recommended SQL Workbench/J. To move the extended sales data as well as other related tables from my S3 bucket I used a series of COPY commands (Amazon recommended way for moving data between these two web services) after TICKIT database objects were created – you can follow THIS link to pull out the SQL code for all CREATE TABLE DDLs. Typical COPY command syntax is modeled on the following structure (applies to S3 data copy only).
COPY table_name [ (column1 [,column2, ...]) ]
FROM { 's3://objectpath' | 's3://manifest_file' }
[ WITH ] CREDENTIALS [AS] 'aws_access_credentials'
[ option [ ... ] ]

where option is

{ FIXEDWIDTH 'fixedwidth_spec'
| [DELIMITER [ AS ] 'delimiter_char']
  [CSV [QUOTE [ AS ] 'quote_character']}

| MANIFEST
| ENCRYPTED
| GZIP
| LZOP
| REMOVEQUOTES
| EXPLICIT_IDS
| ACCEPTINVCHARS [ AS ] ['replacement_char']
| MAXERROR [ AS ] error_count
| DATEFORMAT [ AS ] { 'dateformat_string' | 'auto' }
| TIMEFORMAT [ AS ] { 'timeformat_string' | 'auto' | 'epochsecs' | 'epochmillisecs' }
| IGNOREHEADER [ AS ] number_rows
| ACCEPTANYDATE
| IGNOREBLANKLINES
| TRUNCATECOLUMNS
| FILLRECORD
| TRIMBLANKS
| NOLOAD
| NULL [ AS ] 'null_string'
| EMPTYASNULL
| BLANKSASNULL
| COMPROWS numrows
| COMPUPDATE [ { ON | TRUE } | { OFF | FALSE } ]
| STATUPDATE [ { ON | TRUE } | { OFF | FALSE } ]
| ESCAPE
| ROUNDEC
Without getting too much into what individual parameters are responsible for (detailed explanation can be viewed HERE), executing the following statements moved the data from both – Amazon’s S3 public bucket and my private S3 bucket – into my newly created tables (the whole process took just over 7 minutes with both S3 and Redshift instance in Oregon region).
copy users from 's3://tickit/allusers_pipe.txt' CREDENTIALS 'aws_access_key_id=<your access key id>;aws_secret_access_key=<your secret access key>' delimiter '|';
copy venue from 's3://tickit/venue_pipe.txt' CREDENTIALS 'aws_access_key_id=<your access key id>;aws_secret_access_key=<your secret access key>' delimiter '|';
copy category from 's3://tickit/category_pipe.txt' CREDENTIALS 'aws_access_key_id=<your access key id>;aws_secret_access_key=<your secret access key>' delimiter '|';
copy date from 's3://tickit/date2008_pipe.txt' CREDENTIALS 'aws_access_key_id=<your access key id>;aws_secret_access_key=<your secret access key>' delimiter '|';
copy event from 's3://tickit/allevents_pipe.txt' CREDENTIALS 'aws_access_key_id=<your access key id>;aws_secret_access_key=<your secret access key>' delimiter '|' timeformat 'YYYY-MM-DD HH:MI:SS';
copy listing from 's3://tickit/listings_pipe.txt' CREDENTIALS 'aws_access_key_id=<your access key id>;aws_secret_access_key=<your secret access key>' delimiter '|';
copy sales from 's3://NewSales1.txt'CREDENTIALS 'aws_access_key_id=<your access key id>;aws_secret_access_key=<your secret access key>' delimiter '|';
copy sales from 's3://NewSales2.txt'CREDENTIALS 'aws_access_key_id=<your access key id>;aws_secret_access_key=<your secret access key>' delimiter '|';
copy sales from 's3://NewSales3.txt'CREDENTIALS 'aws_access_key_id=<your access key id>;aws_secret_access_key=<your secret access key>' delimiter '|';
copy sales from 's3://NewSales4.txt'CREDENTIALS 'aws_access_key_id=<your access key id>;aws_secret_access_key=<your secret access key>' delimiter '|';
copy sales from 's3://NewSales5.txt'CREDENTIALS 'aws_access_key_id=<your access key id>;aws_secret_access_key=<your secret access key>' delimiter '|';
copy sales from 's3://NewSales6.txt'CREDENTIALS 'aws_access_key_id=<your access key id>;aws_secret_access_key=<your secret access key>' delimiter '|';
copy sales from 's3://NewSales7.txt'CREDENTIALS 'aws_access_key_id=<your access key id>;aws_secret_access_key=<your secret access key>' delimiter '|';
copy sales from 's3://NewSales8.txt'CREDENTIALS 'aws_access_key_id=<your access key id>;aws_secret_access_key=<your secret access key>' delimiter '|';
copy sales from 's3://NewSales9.txt'CREDENTIALS 'aws_access_key_id=<your access key id>;aws_secret_access_key=<your secret access key>' delimiter '|';
copy sales from 's3://NewSales10.txt'CREDENTIALS 'aws_access_key_id=<your access key id>;aws_secret_access_key=<your secret access key>' delimiter '|';
Loading data into Redshift can also be done using a myriad of third party tools. Amazon has a long list of partners e.g. Informatica, Hapyrus, Attunity, Talend, SnapLogic etc. specializing in data integration along with others which provide more comprehensive packages and tools e.g. Pentaho or Jaspersoft. Many of those tools are available as trial versions so if you’re not comfortable with command line, using those may be a good way to start. It is also worthwhile to watch the Amazon webcast on data integration into Redshift which you can find on YouTube under THIS link.
In the SECOND and THIRD part of this series I will explore the performance findings from running a bunch of sample SQL queries on four different environments (two types of Redshift XL deployments and two different MS SQL Server instances) and try to find out how certain applications such as Tableau or Microsoft Excel work with Redshift data for basic visualizations and analytics.
Posted in: Cloud Computing
Tags: Amazon Redshift, Big Data, Cloud Computing, MPP RDBMS, SQL Server
 Graphing the results, for simplicity sake, I assigned the following monikers to each environment:


Never thought Polybase could be used in this capacity and don't think Microsoft advertised this feature (off-loading DB data as…