How To Build A Data Mart Using Microsoft BI Stack Part 1 – Introduction and OLTP Database Analysis
First of all, as a little introduction, I would like to give you the heads-up that if you are keen to understand the whole SDLC of data mart development, this post is just a prelude to the whole series of posts dealing with the task of creating a comprehensive BI project using Microsoft technology, starting from conducting a little data recognisances, through to creating ETL routines and SQL code logic, cubes, reports and finally deployment and solution fine-tuning. So if you are keen to follow along through the next few posts, you should be able to have a good understanding of how to take a similar project from start to finish using similar approach (links to remaining posts in this series will be added to the very bottom of this page as they accumulate if you wish to jump ahead). Also, I will be placing all relevant files to each post in this series on my public SkyDrive folder (here is the LINK) if you wish to download any resources, code samples, solution files etc.
The reason why I decided to come up with a series of posts outlining how to build a data mart from scratch is because although there is a large pool of materials and publications dealing with the methodologies, approaches and general direction and know-how when developing a robust data mart, I have always felt that there is not enough hands-on, pragmatic, nuts-and-bolts information on the subject. Yes, there are tons of articles and books on individual realms of BI that will teach you how to become proficient ELT developer or an expert MDX programmer, but hardly any of them take the practical approach and apply it from beginning to an end. Having said that, please also note that most data mart or data warehouse development projects are quite complex and deal with a large amount of business specific intricacies hence it is impossible for a short blog post to cover those. Therefore, what you will see over the next few posts relates to the most basic and rudimentary principles and approaches to creating a typical data mart. This, however, should be enough to give anyone a decent overview of the process which then can be applied to other projects without muddying the water too much.
OLTP Database Analysis
Let’s envisage that all the prelude work that precedes the technical aspects is behind us. The feasibility study has been conducted, end users interviewed, project signed off etc. and we, as developers, finally get a chance to get our hands dirty and look at the data. Without further ado, let’s explore the first aspect of data mart development – transactional data. Some would argue that you can build a data mart on data coming from sources other than OLTP database and that this step should not be number one on your agenda i.e. you should be interviewing relevant parties, conducting feasibility analysis etc.…I agree with all of those premises. However, it is much easier to explain the data flow if we have something familiar to work with (in this case our old and trusty PUBS database). Besides, all non-technical prerequisites information can be found in other resources so this will not be the focus of this post. Also, please note that medium to large projects will typically have a “data” person as part of the team; someone who has a fine understanding of transactional systems as well as the business rules that govern those strictly from the data point of view. Typically, data modellers, working in conjunction with business analyst(s) will fill that role. However, it is not unusual that a developer is tasked with defining and designing the dimensional database schema, so be prepared to pitch in, particularly when only a small data mart, not a large enterprise data warehouse is what’s required.
To follow on you will need a copy of PUBS database restored on your MS SQL Server instance. Detailed explanation on how to achieve this can be found in numerous places on the internet (Google is your friend), however, for your convenience, I also included it as part of the solution files which can be found in my SkyDrive folder HERE. The newly created database schema should roughly look as per the image below.
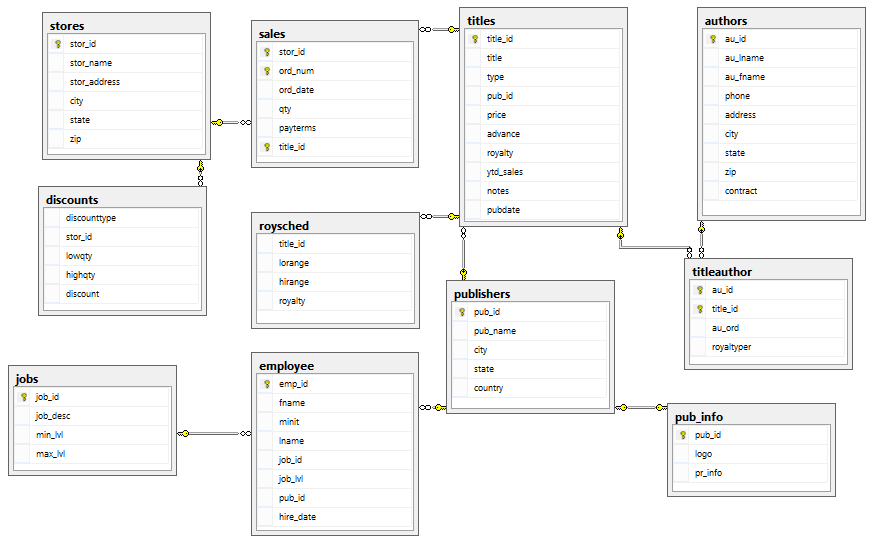
The key table in the above ERD diagram is the dbo.sales table which contains transactional records of each sale e.g. order number, order date, quantity or store id where the transaction was made. Sales transactions will become the focal point of our solution, however, other tables are just as important. Let’s quickly run through some of the entities to see what value they present to the overall solution.
- dbo.stores and dbo.titles tables contain information on which books are sold to which stores therefore they are both useful and worth taking into consideration
- dbo.publishers table contains publishers information. As each title has a publisher assign to it, it may be worth including it in the overall design as end users may want to use this information for further sales analysis
- dbo.authors table contain information on which authors are responsible for writing each book. Sales data will most likely be analysed by titles, however, given the fact that authors’ information is easily accessible; we may also want to take it into consideration
- dbo.employee table contains data about employees who work for each of the publishers which in the context of sales is irrelevant even though on the face value it may seem otherwise
- dbo.jobs table contains information on the employment details for publishers employees which does not present any value at this stage
- dbo.titleauthor table, apart from tracking royalty percentage given to various authors also acts as a bridge table (many-to-many relationship) between dbo.titles and dbo.authors tables. Given the fact that both will be used, this table needs to be included
- dbo.roysched table tracks ranges of royalties based on the amount of books sold. At this stage, even though this information affects the profit data, this table can be treated as irrelevant to the overall sales information and will not be taken into consideration
- dbo.pub_info table will not be used in this project as the data it hold does not have a direct impact on the sales information
- dbo.discounts seems incomplete (only three records with many NULL values) so at this stage will not be used as part of the project
Once we have relevant tables defined, it is time to look at individual attributes and determine which columns contain important information we may consider bringing across into our data mart. Selecting from each table identified as a good source of information, let’s look at their content and what can be utilised to make the most out of the data stored bearing in mind the difference between a measured value and a descriptive value. In the data warehouse measured values are translated into measures, and descriptive values are translated into dimensional attributes.
Many developers will have differing opinions on what is the best way to design a data warehouse. But there are common characteristics you can expect to see in all of them. The first common characteristic is a set of values used for reports. These are called measures. For example, Inventory Units and Sales Dollars can be considered measures. Another common characteristic found in data warehouses is a set of dimensions. Dimensions describe the measured data. Examples of dimensions include the dates that the Inventory Units were documented or the zip code of the customers who bought a particular product. More information on measures versus dimensions topic can be found on the Internet (describing their characteristics is not the purpose of this post); alternatively you can read the widely regarded books and published materials from two most prolific pioneers of data modelling and data warehousing concepts, Ralph Kimbal and Bill Inmon. Also, since neither this post, nor other subsequent posts will cover topics such as granularity, degenerate, junk or roleplaying dimensions, bridge tables etc. in extensive details, please bear in mind that a typical data warehouse project is much more involved and complex and you will probably need to be familiar with such intricacies.
Back to our data and exploring what sort of information the previously described tables hold that may be of interest to data warehouse users.
- Selecting a subset of records from dbo.sales table reveals that qty attribute is a good candidate for a measure as it’s is quantifiable, additive and can provide a business user with the information he/she most likely would want to analyse. Other fields are more descriptive and may be used to provide a context to the sales quantity e.g. ord_date can tell us when the order happened, stor_id describes which location the order originated from etc. Some of those attributes will be necessary to include as dimensional keys as they form a linkage to other tables which in turn contain more descriptive data e.g. stor_id attribute needs reference dbo.stores table in order for us to find out other store details such as location or name
- Selecting from dbo.titles table reveals few interesting facts. First of all, title column contains useful descriptions corresponding to each title_id which is also grouped by individual type. This can potentially allow for rolling titles up by type classification. Moreover, we have a price column which is imperative in finding out the monetary amounts, not just quantities which we get from dbo.sales table
- Looking at dbo.publishers table we can see that publishers’ names along with some location details occupy majority of the data. Publisher name attribute would be something that we may consider using in the report so we can dimension our data by those attributes
- dbo.authors table contains, as the name suggests, details pertaining to authors. It’s a good example of a table which has data that can be useful from a dimension point of view as most of its attributes are descriptive
- Looking at the data from dbo.titleauthor table reveals that this object is necessary in order to connect dbo.authors and dbo.titles together. Therefore, the two columns – au_id and title_id – which make up the composite keys are essential to be included
- dbo.stores table, similarly to dbo.authors table, contains mainly descriptive data referring to stores’ locations and names. This is another good example for a dimension with all attributes presenting a value for potential repot slicing, dicing and drill-through
Apart from the objects we have analysed that may potentially turn/merge into either fact table(s) or dimension tables, nearly all data marts also include a ‘synthetic’ dimension containing dates and the corresponding formats which gets populated based on specific business needs. Even though this table does not participate in the same process we go through when modelling dimensions and facts based on OLTP database, it is imperative to consider its structure as part of the overall OLAP schema planning as dates (along with their derived values) are almost always imperative to providing valuable context for the fact analysed (more on how to build a DimDates table for this solution in the subsequent post for this series; alternatively check out THIS post for more comprehensive solution).
It seems that now we should have enough conceptual details around the objects, the data they hold and whether they are useful for proceeding with the data mart solution development. In the NEXT POST I will look at some architectural pitfalls when moving into the next phase of development and start to develop the code base for advancing into OLAP schema creation.
Please also check other posts from this series:
- How To Build A Data Mart Using Microsoft BI Stack Part 2 – OLAP Database Objects Modelling
- How To Build A Data Mart Using Microsoft BI Stack Part 3 – Database Load Approach And Coding
- How To Build A Data Mart Using Microsoft BI Stack Part 3 – Data Mart Load Approach And Coding
- How To Build A Data Mart Using Microsoft BI Stack Part 4 – Data Mart Load Using SSIS
- How To Build A Data Mart Using Microsoft BI Stack Part 5 – Defining SSAS Project And Its Dimensions
- How To Build A Data Mart Using Microsoft BI Stack Part 6 – Refining SSAS Data Warehouse Dimensions
- How To Build A Data Mart Using Microsoft BI Stack Part 7 – Cube Creation, Cube Deployment And Data Validation
- How To Build A Data Mart Using Microsoft BI Stack Part 8 – Creating Sample SSRS Report
All SQL code and solution files can be found and downloaded from HERE.
http://scuttle.org/bookmarks.php/pass?action=addThis entry was posted on Sunday, September 8th, 2013 at 11:45 pm and is filed under Data Modelling, How To's. You can follow any responses to this entry through the RSS 2.0 feed. You can leave a response, or trackback from your own site.


Building A Complete Data Solution Using The Microsoft BI Stack | OdeToData July 26th, 2015 at 6:18 pm
[…] Part 1 – Introduction and OLTP Database Analysis […]