How To Build A Data Mart Using Microsoft BI Stack Part 8 – Creating Sample SSRS Report
In this PREVIOUS POST I focused on the concepts of SSAS solution deployment and cube creation as well as went through some basic validation techniques to ensure that our data mart has correct data in it before it can be reported out of. This final post deals with reporting out of our data mart using SQL Server Reporting Services (SSRS) – another application being part of the comprehensive Microsoft BI stack (I have already covered SSIS and SSAS in previous posts).
There are many different ways to report on data stored in the data mart. For impromptu and ad hoc data analysis Excel cannot be beaten on user friendliness and ease of development. Having said that, I have seen many Excel reports which were more like stand-alone applications, with thousands of lines of VBA code mixed with SQL and MDX so given this tool’s flexibility, I would not dismiss it as lightweight and simple. Also, given that Excel seems to be getting all the attention as far as the direction Microsoft wants to take its reporting tools in, with many bells and whistles, particularly in version 2013, it is expected that Excel, not other applications will gain traction over the coming years. For more ‘pixel-perfect’ reports however, SSRS is still a great and powerful tool to use and it will be the focus of this post.
There are two applications that SSRS reports can build in: Report Builder and Visual Studio. Report Builder is designed to be user-friendly, and its GUI interface is designed to have the look and feel of Microsoft Office so that developers accustomed to building reports in either Microsoft Access or Excel will feel right at home. Unlike Visual Studio, Report Builder is not automatically installed when you install SQL Server 2012. It must be downloaded from the Internet and installed separately. Report Builder is designed for casual developers. It provides most, but not all, of the features that come with Visual Studio. For more feature-rich development, Visual Studio’s Reporting Services project provides full-featured development. With it you can accomplish everything that can be done in Report Builder, plus you have the ability to manage multiple files concurrently, work directly with source control, and include the Reporting Services project in the same solution as SSIS and SSAS projects.
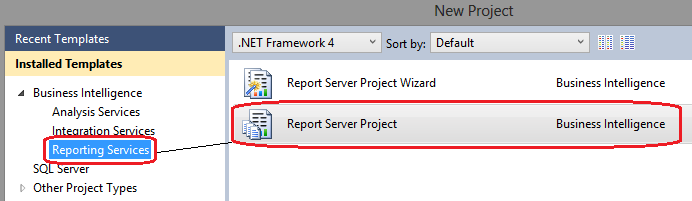
There are many aspects of Reporting Services that an astute developer would have to get acquainted with e.g. SSRS administrative services, SSRS configuration manager, deployment and scheduling process etc. They won’t be covered here but there is copious amount of information on the internet relating to the management side of SSRS specifically. Without further ado, let’s jump into creating our first SSRS report based on the data in our data mart. Let’s open up Visual Studio and create a new project selecting Report Server Project from the options provided.
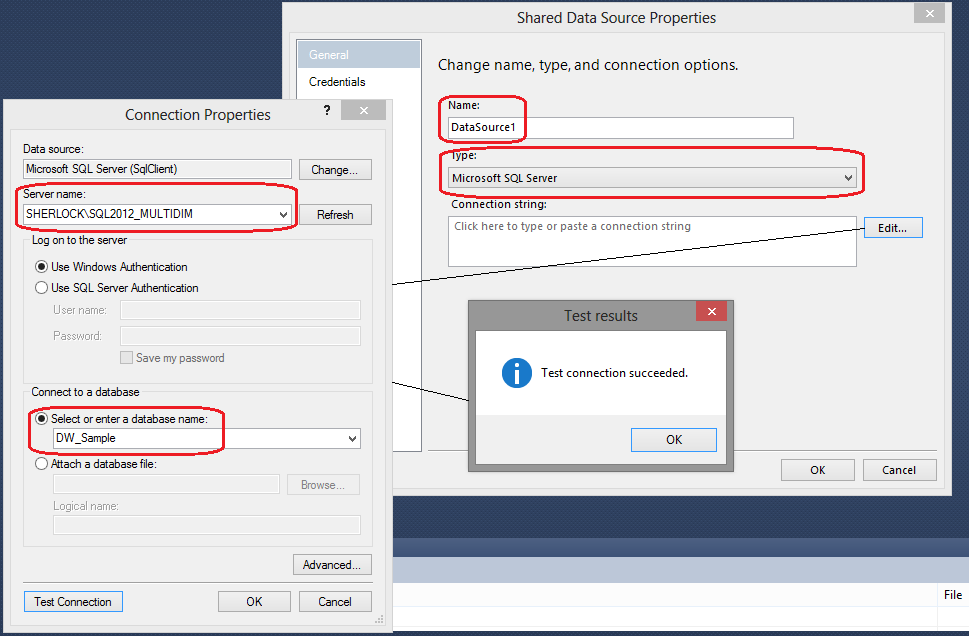
Once the project has been created, you can see it in Solution Explorer. Next, let’s create one or more data sources. Data sources provide the connection information for your reports. To create a shared data source, right-click the folder called Shared Data Sources and select the Add New Data Source option from the context menu. The Shared Data Source Properties dialog window will appear. In the Shared Data Source Properties dialog window, you enter a name for your new data source, select the type of connection to create, and provide a connection string as per image below.
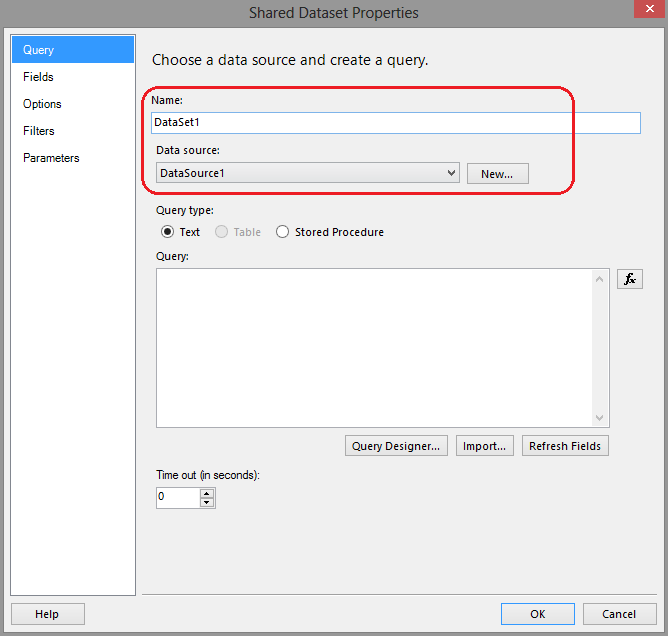
After we create our data sources, we then make one or more datasets. Datasets contain query string used to generate report data. The query string language is dependent on which type of connection is used. For example, if you are connecting to a SQL Server database, use the SQL language. If you are connecting to an Analysis Server database, use a language such as MDX. To create a shared dataset, right-click the Shared Datasets folder in Solution Explorer and choose Add New Dataset from the context menu. A Shared Dataset Properties dialog window appears where you can identify the name, data source, query type, and query for the dataset as per image below. Let’s not populate the query pane with any SQL just yet and leave it blank.
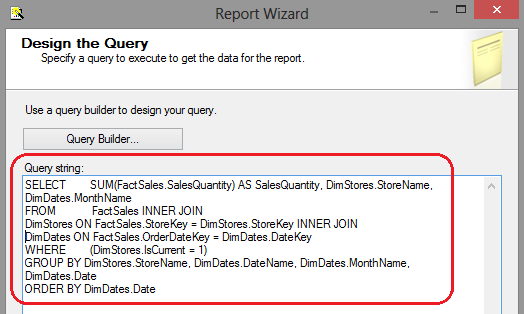
Once our data source and initial dataset have been defined, right-clicking the Reports folder in Solution Explorer and choosing Add New Report. This will trigger the wizard which we can use to define our report data source and the query which will drive the reports data. Next, on the Design the Query pane, enter the following SQL.
SELECT SUM(FactSales.SalesQuantity) AS SalesQuantity, DimStores.StoreName, DimDates.DateName
FROM  FactSales INNER JOIN
DimStores ON FactSales.StoreKey = DimStores.StoreKey INNER JOIN
DimDates ON FactSales.OrderDateKey = DimDates.DateKey
WHERE (DimStores.IsCurrent = 1)
GROUP BY DimStores.StoreName, DimDates.DateName, DimDates.Date
ORDER BY DimDates.Date
At this stage the wizard should look as per image blow.
When on Select the Report Type step, click on Matrix radio button. Click Next to proceed to Design the Matrix step and adjust the properties as per image below.
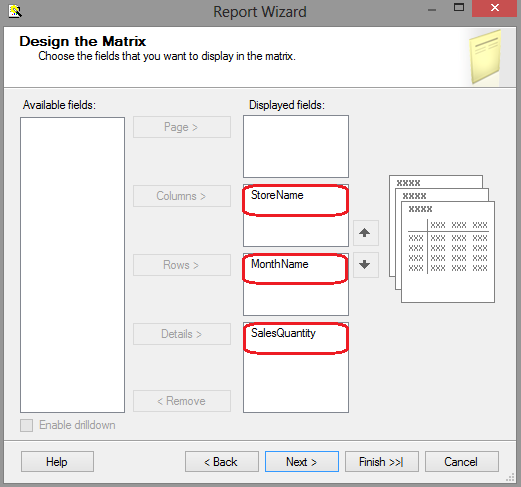
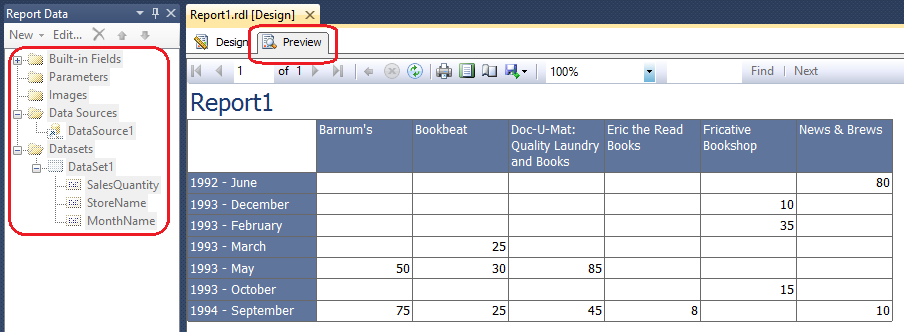
Continuing on, you can choose to finish the wizard or go to next step to adjust the theme you wish to apply and assign the report name. When completed, click on Finish to conclude the wizard. At this stage all we have is a very simple sales matrix with sales amount measures partitioned by store name and particular month. You can also see a tree-view of individual objects which make up this report on the left-hand side with data sources, data sets and individual attributes coming from data mart tables. We can run the report clicking on Preview button in the top left corner of the design pane.
At this point the report looks quite simplistic and there is no level of interactivity. It may be OK for someone who would only run it to export the results to Excel and do further manipulation on the data or for someone who gets it emailed every day/month to casually look at the figures for any deviations from the norm. However, as it was the case with SSIS in POST 4, there is much more you can do in order to make it more functional, easy on the eye and interactive. SSRS allows the concept of parameters which you can use to slice/filter data before it gets outputted onto the report. There is a large number of components available (either default ones from the Visual Studio project toolbar or third party) which can really bring your reports to life so extensibility is not a problem. Below is a sample image of the same report with a few extra components added to make it look more dashboard-like (click on the image to enlarge it). This took only a few minutes to put together but the result is a report which is more visually appealing and a little bit more interactive (I included one parameter as a drop-down list with multiple values allowed to be selected in the top, left corner which permits end-users to filter the data based on the StoreName attribute).
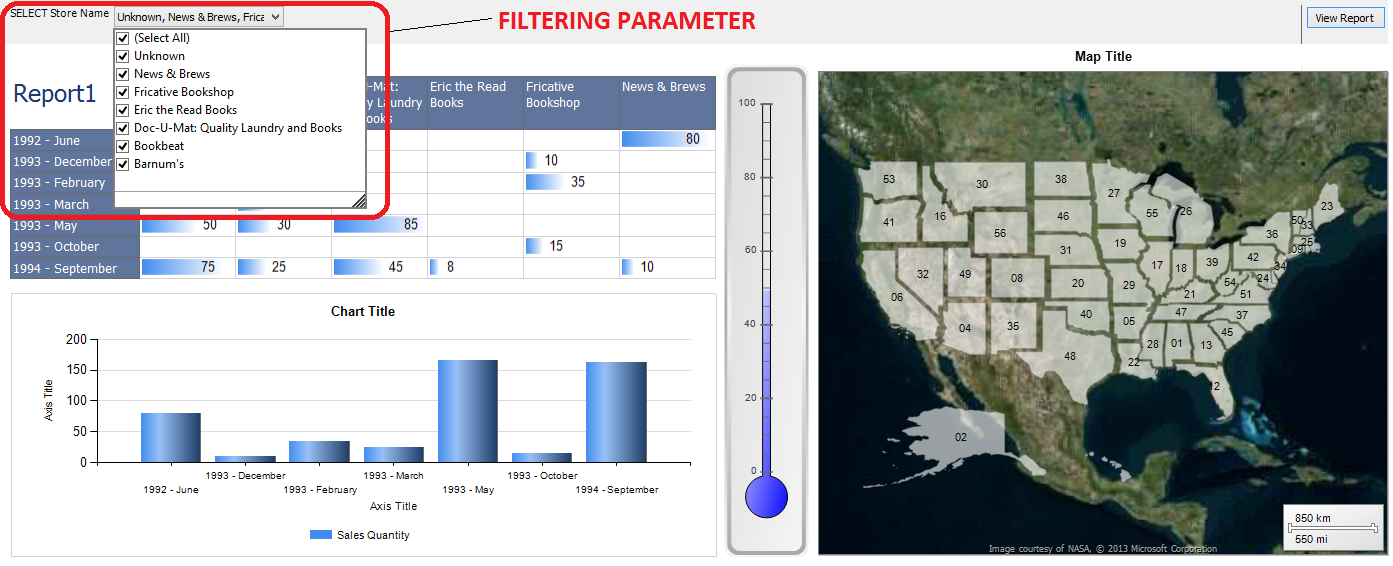
All additional components in this report are included in SSRS (2012 version) by default so you can really come a long way before running out of customisation options with just out-of-the-box functionality e.g. gauges, Bing maps, sparklines and of course .Net extensibility. If you want something more interactive e.g. more analytical reporting with real-time, dynamically driven interface, there is lots of options out there. Excel should not disappoint if you already have a solid investment in Microsoft stack. Version 2013, with the inclusion of PowerView, PowerPivot, PowerMap etc. is a terrific option for self-service, dynamic data analysis. This, coupled with SharePoint deployment and SQL Server database(s) should provide an enterprise ready solution for most of your needs. Otherwise, vendors such as Tableau, ClickView or SAP with its Lumira are pretty good but the price may prove to be prohibitive for many.
This concludes this post and this series (eight posts altogether). If you stumble upon this or any other post from the ‘How To Build A Data Mart’ collection on my blog don’t hesitate to leave me a comment – any feedback is appreciated, good or bad! As usual, solution files for this SSRS project as well as all other posts for this series can be found and downloaded from HERE.
Please also check other posts from this series:
- How To Build A Data Mart Using Microsoft BI Stack Part 1 – Introduction And OLTP Database Analysis
- How To Build A Data Mart Using Microsoft BI Stack Part 2 – OLAP Database Objects Modelling
- How To Build A Data Mart Using Microsoft BI Stack Part 3 – Data Mart Load Approach And Coding
- How To Build A Data Mart Using Microsoft BI Stack Part 4 – Data Mart Load Using SSIS
- How To Build A Data Mart Using Microsoft BI Stack Part 5 – Defining SSAS Project And Its Dimensions
- How To Build A Data Mart Using Microsoft BI Stack Part 6 – Refining SSAS Data Warehouse Dimensions
- How To Build A Data Mart Using Microsoft BI Stack Part 7 – Cube Creation, Cube Deployment And Data Validation
This entry was posted on Monday, September 16th, 2013 at 5:56 am and is filed under How To's, SQL, SSRS. You can follow any responses to this entry through the RSS 2.0 feed. You can leave a response, or trackback from your own site.


admin November 11th, 2013 at 6:15 am
My pleasure! Hope you found it useful……Marcin