Amazon Redshift Review – Data Warehouse in the Cloud Is Here, Part 3
In the FIRST installment to this series I briefly outlined the environment setup as well as Redshift data loading process. This was followed by my SECOND post where I analyzed performance findings when comparing query execution times on 4 different environments. In this post I would like to explore Redshift database connectivity options for data visualization applications – Tableau and Microsoft Excel – as well as provide a brief summary of my experience with Redshift up until this point.
Microsoft Excel
Let’s start with the venerable Excel. There is probably no tool on the market which can beat Excel for its popularity, functionality and number of users who have had some experience with it. It is the love child of many corporate departments and a staple, go-to application when impromptu analysis and visualisation is required. Furthermore, with the latest release of Excel 2013 it has an added benefit of creating fancy dashboards or geospatial mappings using plugins such as PowerMap and PowerView with relative ease.
Connecting to Redshift via Excel is quite straightforward. As I do not want to repeat the step-by-step details on how to link your spreadsheet to Redshift data source – someone else has already done it for me – I will just post a link to the webpage where this information can be found. Under this LINK you will find comprehensive tutorial on how to achieve this. Alternatively, in case the link is no longer valid, head over to my SkyDrive folder HERE where among other files I saved a screen dump as an image file.
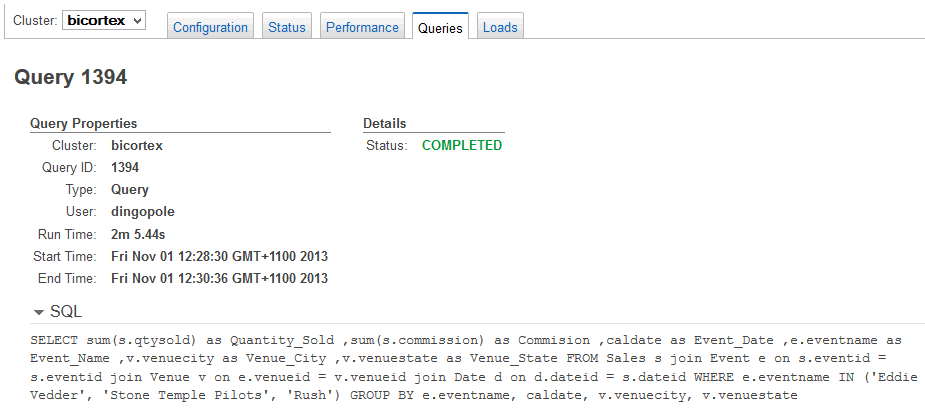
In order to visualize data stored in Redshift, I used the following two SQL queries returning aggregated results running on a multi-node deployment (2 nodes) on High Storage Extra Large (XL) DW instance.
SELECT
SUM(s.qtysold) as Quantity_Sold
,SUM(s.commission) as Commision
,caldate as Event_Date
,e.eventname as Event_Name
,v.venuecity as Venue_City
,v.venuestate as Venue_State
FROM Sales s
  join Event e on s.eventid = s.eventid
  join Venue v on e.venueid = v.venueid
  join Date d on d.dateid = s.dateid
  WHERE e.eventname IN ('Eddie Vedder', 'Stone Temple Pilots', 'Rush')
  GROUP BY e.eventname, caldate,
  v.venuecity, v.venuestate
SELECT
SUM(s.pricepaid) as Price_Paid,
d.day as Sales_Date,
e.eventname as Event_Name,
u1.city as City,
u1.state as State
FROM
sales s join users u1 on u1.userid = s.sellerid
join date d on d.dateid = s.dateid
join event e on s.eventid = e.eventid
WHERE d.holiday <> 1 and e.eventname <> 'Shrek the Musical' and u1.state <> 'IL' and EXISTS
		(SELECT 1
		FROM users u2 WHERE u2.userid = u1.userid
		and COALESCE(u2.likesports, u2.liketheatre, u2.likeconcerts, u2.likejazz, u2.likeclassical,
		u2.likeopera, u2.likerock, u2.likevegas, u2.likebroadway, u2.likemusicals) = 1)
GROUP BY
d.day,d.caldate,e.eventname, u1.state, u1.city
ORDER BY d.caldate ASC
On connection imported data from two queries above into my worksheets to observe cluster’s performance during execution. I wasn’t looking for anything specific and no particular variables were taken into consideration. The aim was simply to determine how flexible and issue-free using Excel as visual output can be as the Redshift front end. During data import, Excel becomes pretty much unresponsive, which depending on the query execution time can be frustrating. The only indication that data is being sourced or waited on was this little message in the bottom pane of the spreadsheet.

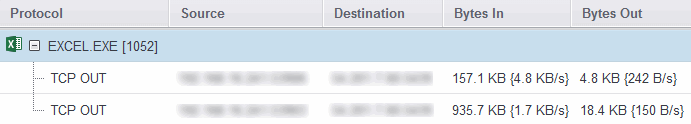
Also, in terms of network activity, I recorded fairly minimal traffic, with most of the time spent on waiting for the data to process before the final output.
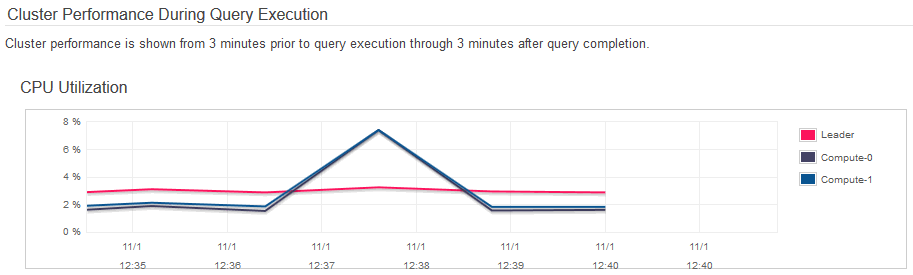
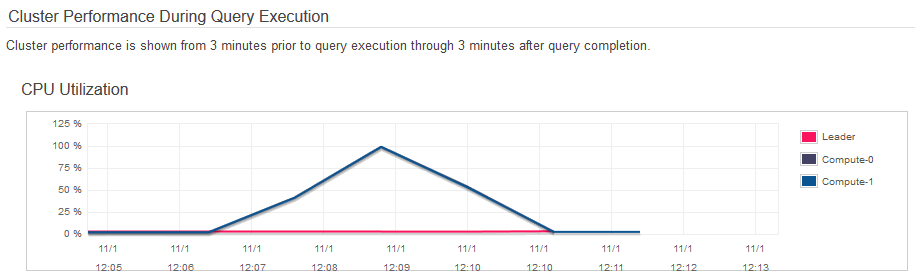
In the case of the first query , SQL code execution time, regardless of the application connecting to Redshift (Excel, SQL Manager, Tableau etc.), was quite long with just over 2 minutes to crunch my sales and commission data from the extended TICKIT database. Also, as you can see from the images below, CPU spiked to 100 percent for a short period of time during query 1 processing.
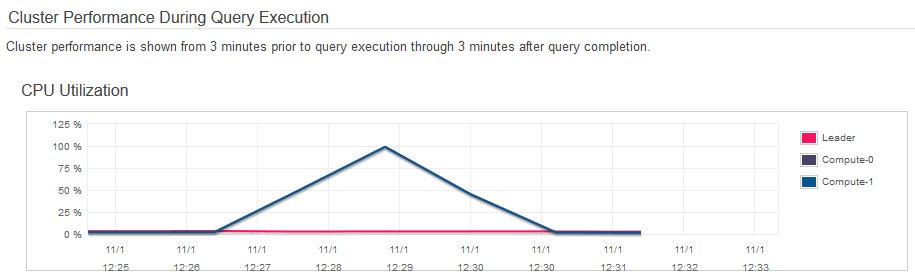
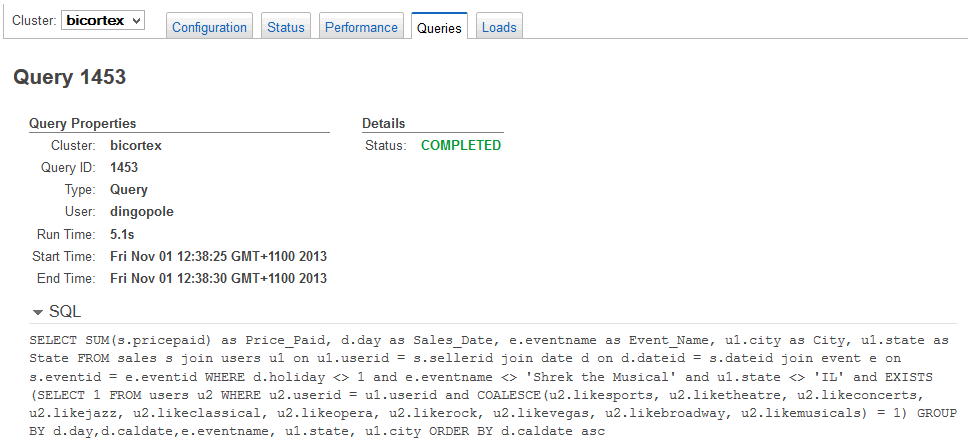
Things were much snappier with query 2 which took hardly any time to run and populate my worksheet. Also, CPU utilisation was kept below 10 percent for both nodes involved.
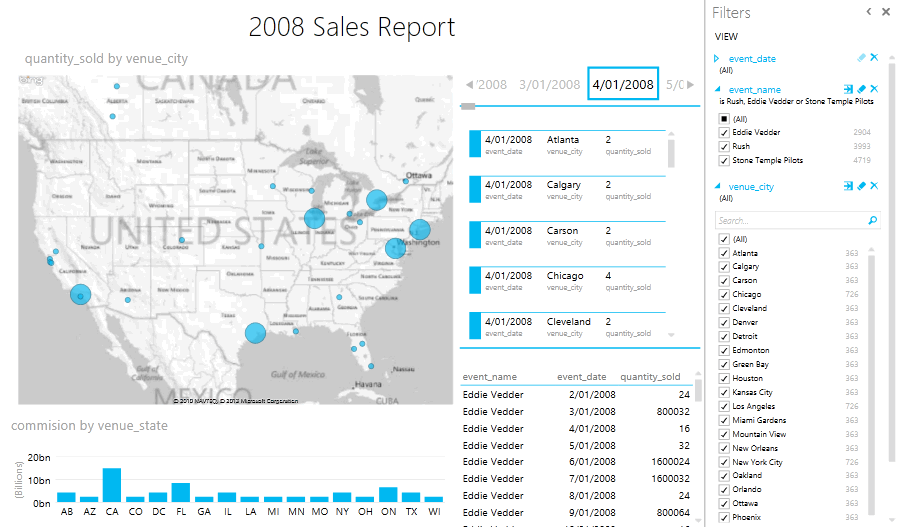
Overall ease of use and flexibility Excel comes with is very good and it literally took me 5 minutes from the moment I run the first query to putting a small Sales dashboard report together (click on image to enlarge).
Tableau
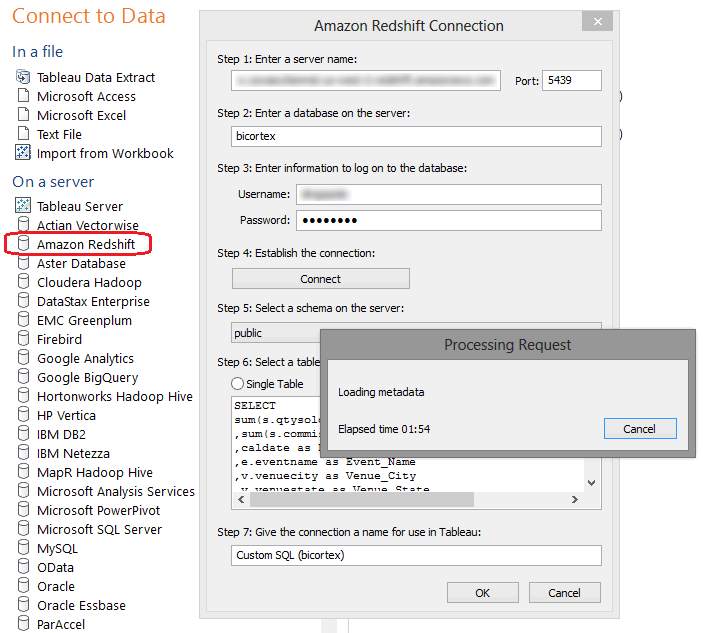
Tableau is quickly becoming the go-to application for rapid data analysis and I can see more and more businesses using it as a primary tool when it comes to visualisation and data exploration. It is also known for its vast connectivity options and Amazon Redshift is also included by default. Connecting to Redshift cluster is quite straightforward – given that Redshift integration is there out-of-the-box, all that’s required is filling in the blanks with authentication credentials and choosing between importing all database objects or running a selective query as per below.
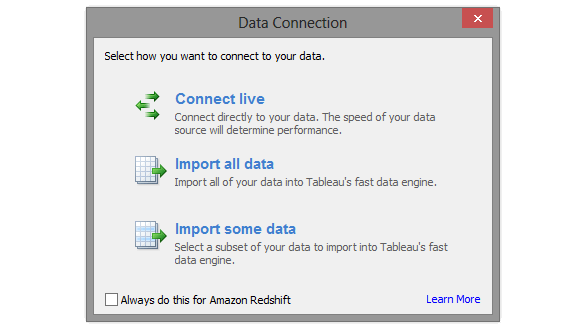
Next, Tableau imports database and objects metadata and provides 3 options for how the data interface between Redshift and the application should be managed – connect live, import all data or import some data.
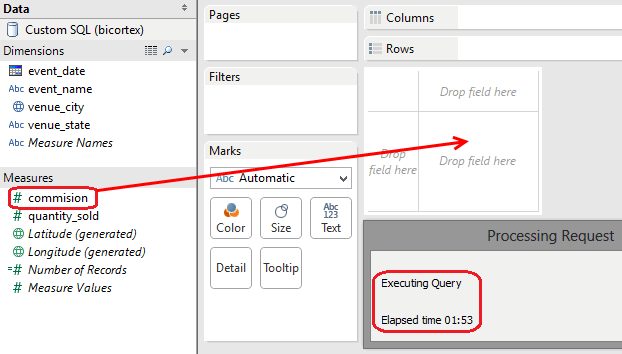
Unfortunately, working with the ‘active connection’ turned out to be quite problematic and only highlights why remotely hosted data warehouse can potentially be a big issue, at least when using Tableau in ‘always connected’ mode. Network latency is not a problem here as only a small subset of data is being returned to the client. Also, I could live with the fact that query execution time can, in some cases, be longer than anticipated thus adding to the increasing frustration. However, I would not be able to put up with a setup which provides the flexibility of real-time data interrogation for the price of great inconvenience and deficiency in how the current architecture is resolved. What I am referring to here is the way Tableau works with data, aggregating, sorting, and manipulating it when conducting the analysis. It appeared to me that, for query 1, for example, which as I have already mentioned took around 2 minutes to process, not only did I have to wait 2 minutes just for the metadata to be returned to the client but each time the application was required to reference the source dataset, additional 2 minutes were wasted for further execution due to lack of adequate optimisation. To explain further, let’s look at the image below outlining creating the initial data analysis sheet.
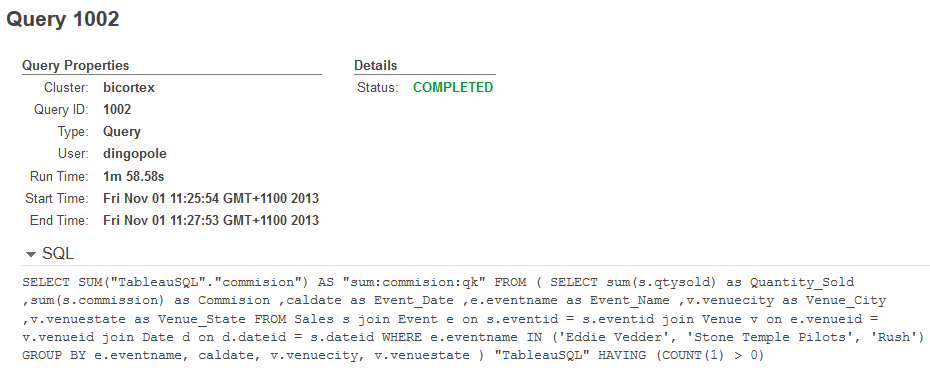
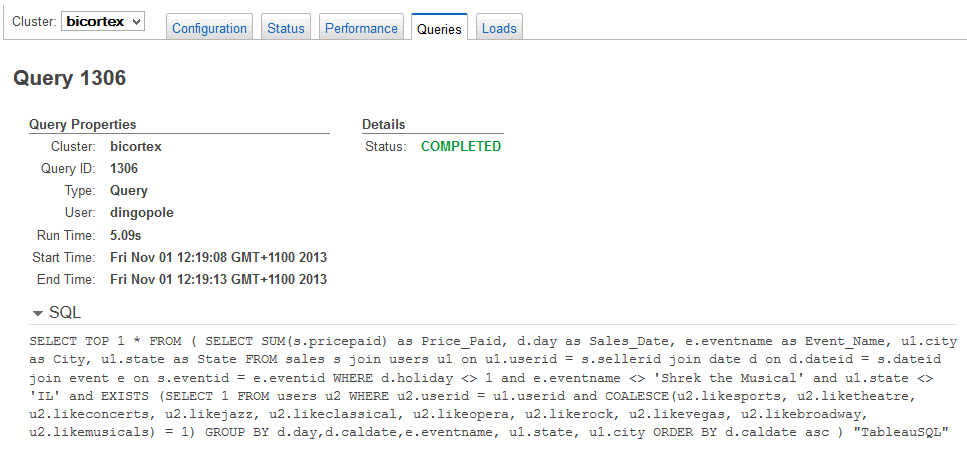
Nearly the same query was executed when attempting to drag ‘commission’ measure onto the summary field as we saw in the case of metadata fetching, which means that every time a new aggregation is created in Tableau, additional 2 minutes were added (read: wasted) for the query to hit Redshift’s processing engine, crunch the data and return it over the network. This means that utilizing live connection to the data source was virtually prohibitive and could severely impact the ‘what was intended as the quick analysis project’ to the point of time-unaffordable lag. Looking at the query which was passed to Redshift from Tableau when trying to summarize ‘commission’ figures I could tell that there’s literally zero optimization done (server catching, local memory staging etc.) to prevent from this inefficient, repetitive ‘SELECT OUT OF SELECT’ execution (see image below).
I can hear you saying that I could always mitigate all those problems by importing all or some data into my local environment. I concur. Given that the datasets are quite small I tried to import all the records and everything worked really well, however, given that Redshift’s primary market is high volume data deployments, I would not be able to stage millions or billions of records on my machine, I wouldn’t even want to. This conundrum proves that even though cloud data warehousing is making strides towards wider audience and higher adoption, there are still some big issues that can render it useless for some specyfic applications.
Working in off-line mode, with all data imported and staged on my local machine the experience was much more rewarding and Tableau was a pleasure to work with.
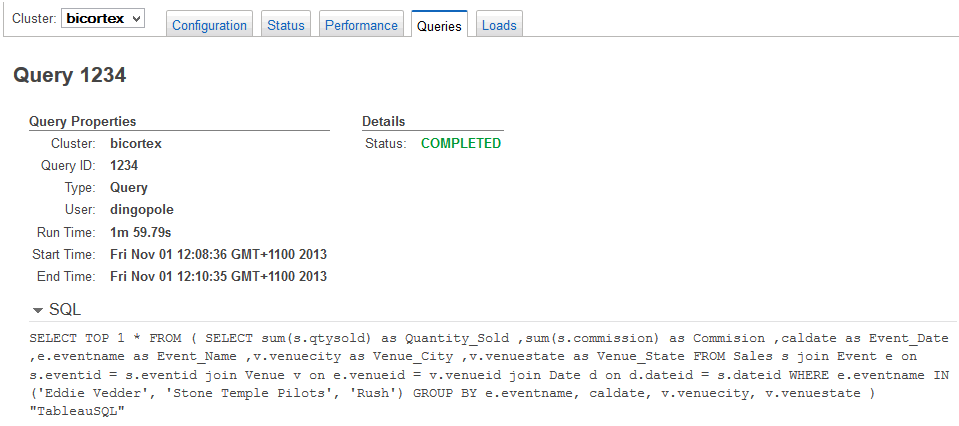
Below are the queries’ CPU performance metrics as well as SQL statements passed for execution. Notice how Tableau formats SQL code with prefixing it with ‘SELECT TOP 1 * FROM…’ statement.

Final Conclusion
So what is the overall verdict on Amazon Redshift? In my books, even though the product is still rough around the edges and a bit more polish and finesse needs to be applied here and there, Redshift is a real deal. It performs very well, is easy to provision and manage, it has good connectivity options and the price is competitive. I would never though that I could deploy such a powerful architecture on an impromptu basis, perform my analysis and scrap it – all within less than one hour with the price paid cheaper than a cup of coffee. On one hand, this is a welcomed development as it has never been so easy and inexpensive to process huge volumes of data with minimal input. No longer does one need to pay for exorbitant licensing costs, employ legions of DBAs and system administrators or have a very good handle on the esoteric subjects or database programming and administration. Such deployment takes away most of the cost, human input and associated complexities thus empowering end users and making such technologies accessible to a wider audience. At the same time, it’s not the elusive real life unicorn of the data warehousing world and it won’t solve all your BI problems. With all its benefits and advantages revolving primarily around speed and cost, it does not support many common database features, your data is stored in the cloud (encrypted or not) which can pose security issues for some, more tightly regulated workshops and finally, its management flexibility is still on the “I wish I could do such and such…” side. Throw in data latency issues with many businesses still operating on barely adequate internet speed and somewhat inferior analytical applications support when working with ‘live’ data and the whole concepts can lose its shine pretty quickly. Moreover, I can anticipate that some IT professionals will be reluctant to recommend such solution to their managers in fear of falling into obsolescence. Quoting my unenthusiastic friend, ‘the fond years of database administrators being the center of all business activities are slowly getting reduced to documentation management, mostly taking away the mental challenge and hard-core problem solving opportunities’. I would imagine that many professionals who can slowly feel the ‘cloud pinch’ will boycott (at least initially) the business transition to such technology, foreseeing their demise if no skills adjustments are made on their part. I may be overdramatising here but regardless of what your attitude is, cloud data warehousing is here to stay and Amazon Redshift is a perfect example of how fast, cheap, scalable and manageable such technology could be. From my point of view, given you have a problem which definition can fit into its capabilities, Redshift is a force to be reckoned for other vendors and a powerful and cost effective solution for those who manage and use it.
http://scuttle.org/bookmarks.php/pass?action=addThis entry was posted on Saturday, November 2nd, 2013 at 11:31 am and is filed under Cloud Computing. You can follow any responses to this entry through the RSS 2.0 feed. You can leave a response, or trackback from your own site.


