How To Build A Data Mart Using Microsoft BI Stack Part 2 – OLAP Database Objects Modelling
September 9th, 2013 / No Comments » / by admin
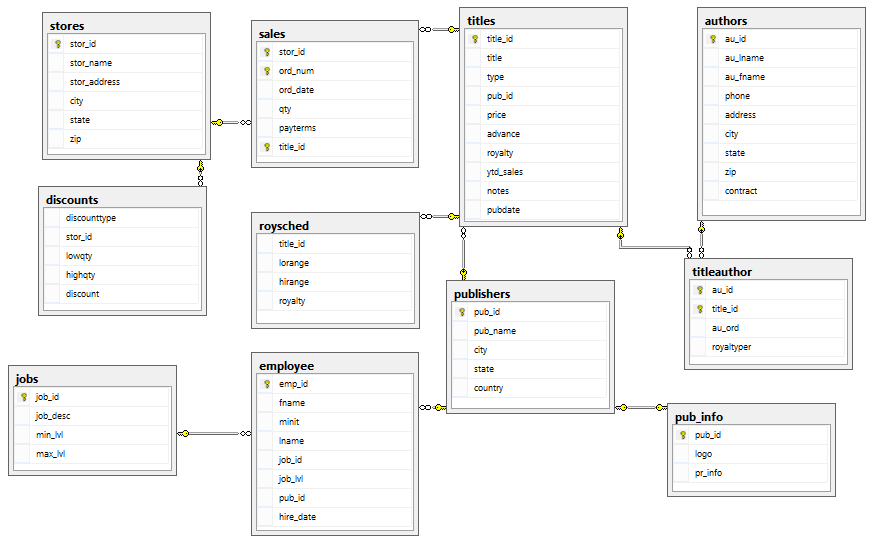
In the FIRST POST to this series I analysed the schema, objects and the data they hold for our mini data mart project. In this post I would like to start digging into more nuts-and-bolts data warehouse development with some key concepts emphasised and preliminary code base for data mart objects developed.
Key Concepts
I was going to refrain from discussing the intricacies and principles of data mart design in more details, however, there are three concepts which I’d like to mention as they will form a linchpin of any further modelling or development activities we will proceed with. Number one is the concept of de-normalization. As opposed to OLTP data bases which typically focus on insert and update performance whilst minimising reads through dividing large tables into smaller and less redundant objects and defining relationships between them, OLAP design leans towards the process of attempting to optimize the read performance by adding redundant data or by grouping data, often referred to as de-normalizing. The focus here is on report performance and readability rather than lack of redundancy. A normalized design will often store different but related pieces of information in separate logical tables (called relations). If these relations are stored physically as separate disk files, completing a database query that draws information from several relations (a join operation) can be slow. If many relations are joined, it may be prohibitively slow. De-normalizing facilitates retrieval speed making query performance much more efficient. Following this logic, if the operational database stores locations in three separate tables to provide hierarchical view e.g. dbo.country, dbo.state and dbo.city, for the purpose of dimensional modeling we can roll this data up into one table called dbo.location. In that way, in order to retrieve sales data, for example, for any given post code stored in dbo.city table we will not need to traverse two other tables thus implicating unnecessary joins. Providing that sales data comes from fact dbo.sales table which is directly connected to dbo.location dimension, only one join will be involved rather than having to navigate through additional two joins. As our OLTP schema in pubs database is mostly designed in such way that collapsing multiple tables into one dimension or fact is hardly necessary, this becomes a straightforward exercise. For more detailed overview of the methodology involved in dimensional modeling you may want to read THIS DOCUMENT. Alternatively, there is copious amount of great publications available through the Internet.
Another important fact around dimensional modeling is the concept of surrogate keys. The idea is that instead of heaving values that naturally occur in OLPT environment, we have synthetic integer value that acts as dimension key. This surrogate key then becomes a foreign key in the fact table creating a relationship between the two. It is considered best practice to implement on all dimensions, possibly with the exception of date dimension which, depending on the school of thought you subscribe to, recommends storing converted date in a format DDMMYYYY as a table key, inserting an integer surrogate key or doing nothing and storing date in a pure date format (either way the key should be made up of unique values only). Surrogate keys assist when merging data from many dispersed OLTP systems, improve query performance and allow for changes tracking e.g. Slowly Changing Dimensions concept (more on SCD concept in subsequent posts to this series).
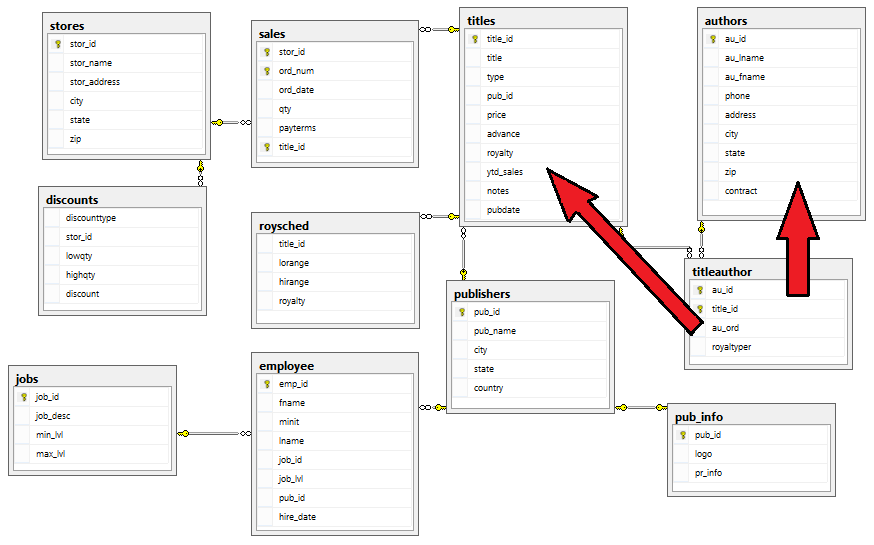
Finally, the concept of bridge tables also called associative entities. A bridge table’s purpose is to provide a connection between many-to-many dimension tables, and it is often referred to as a factless fact table. If we look at the below image with the objects highlighted and imagine that dbo.sales will become primary fact table, whereas dbo.authors and dbo.titles will be converted into dimension tables, we will notice that in order to process authors’ information we will need to go thorough titles’ data and its associated dbo.titleauthor table. Therefore, dbo.titleauthor table is a good candidate for a factless fact table – a fact table that serves as a link between two dimensions.
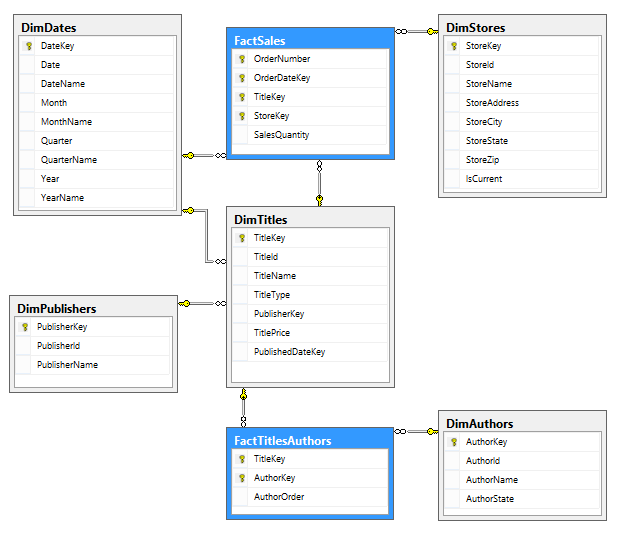
Based on the above information, and the schema/data analysis from POST 1 we can conclude that sales table in pubs database will become our fact table; publishers, authors, titles and stores will become dimension tables whereas dbo.titleauthor bridge table will become a factless fact table. Therefore, once all objects have been created (see the SQL code further on in this post), the data mart schema should resemble the diagram as per image below.
There is a multitude of other concepts that are very relevant when it comes to data mark design and modelling. Taking dimensions modelling only, notions such as conformed dimensions, Slowly Changing Dimensions (I outlined SCD approach HERE, HERE, HERE and HERE), junk dimensions, parent-child dimensions, role-playing dimensions, degenerate dimensions etc. come to my mind; however, given the conciseness of this post and the intended purpose – technical details over paradigms and methodologies – I will need to refer to those and other concepts as we go through the remainder of this series.
SQL Code
Let’s dive into less conceptual aspects of data mart design – scripting out our data mart objects based on the information from Post 1 and the concepts covered at the start of this post. First, I created two directories on my C:\ drive which I will use for storing the SQL Server data, log and back up files – DW_Sample_Files on the C:\ drive and a second DW_Sample_BackUp directory within it. Next, I will create a new DW_Sample database (this will be our relational warehouse database), all its objects as well as perform a back up to the nominated directory. All this is done via T-SQL rather than using SQL Server Management Studio graphical interface which should reduce the number of screen shots and steps involved. I have also included detailed description of individual sections of the script for further clarification and analysis.
/*
STEP 1
Check if the database we wish to create is already in place and if so
drop it and recreate it with files (log and data) located as per
description above. Next, assign login SA (administrator) as the database
owner and set the recovery model to BULKED_LOGGED.
*/
USE [master]
GO
IF EXISTS (SELECT name FROM sys.databases WHERE name = N'DW_Sample')
BEGIN
-- Close connections to the DW_Sample database
ALTER DATABASE [DW_Sample] SET SINGLE_USER WITH ROLLBACK IMMEDIATE
DROP DATABASE [DW_Sample]
END
GO
CREATE DATABASE [DW_Sample] ON PRIMARY
( NAME = N'DW_Sample'
, FILENAME = N'C:\DW_Sample_Files\DW_Sample.mdf'
, SIZE = 10MB
, MAXSIZE = 1GB
, FILEGROWTH = 10MB )
LOG ON
( NAME = N'DW_Sample_log'
, FILENAME = N'C:\DW_Sample_Files\DW_Sample_log.LDF'
, SIZE = 1MB
, MAXSIZE = 1GB
, FILEGROWTH = 10MB)
GO
--Assign database ownership to login SA
EXEC [DW_Sample].dbo.sp_changedbowner @loginame = N'SA', @map = false
GO
--Change the recovery model to BULK_LOGGED
ALTER DATABASE [DW_Sample] SET RECOVERY BULK_LOGGED
GO

/*
STEP 2
Create individual objects i.e. fact and dimension tables and create
foreign keys to establish referential integrity between individual tables
*/
USE [DW_Sample]
GO
--Create the Dimension Tables
CREATE TABLE [dbo].[DimStores](
[StoreKey] [int] NOT NULL PRIMARY KEY IDENTITY (1, 1),
[StoreId] [nchar](12) NOT NULL,
[StoreName] [nvarchar](50) NOT NULL,
[StoreAddress] [nvarchar] (80) NOT NULL,
[StoreCity] [nvarchar] (40) NOT NULL,
[StoreState] [nvarchar] (12) NOT NULL,
[StoreZip] [nvarchar] (12) NOT NULL,
[IsCurrent] [int] NOT NULL
)
GO
CREATE TABLE [dbo].[DimPublishers](
[PublisherKey] [int] NOT NULL PRIMARY KEY IDENTITY (1, 1),
[PublisherId] [nchar](12) NOT NULL,
[PublisherName] [nvarchar](50) NOT NULL
)
GO
CREATE TABLE [dbo].[DimDates](
[DateKey] int NOT NULL PRIMARY KEY IDENTITY (1, 1),
[Date] datetime NOT NULL,
[DateName] nVarchar(50),
[Month] int NOT NULL,
[MonthName] nVarchar(50) NOT NULL,
[Quarter] int NOT NULL,
[QuarterName] nVarchar(50) NOT NULL,
[Year] int NOT NULL,
[YearName] nVarchar(50) NOT NULL
)
GO
CREATE TABLE [dbo].[DimAuthors](
[AuthorKey] [int] NOT NULL PRIMARY KEY IDENTITY (1, 1),
[AuthorId] [nchar](12) NOT NULL,
[AuthorName] [nvarchar](100) NOT NULL,
[AuthorState] [nchar](12) NOT NULL
)
GO
CREATE TABLE [dbo].[DimTitles](
[TitleKey] [int] NOT NULL PRIMARY KEY IDENTITY (1, 1),
[TitleId] [nvarchar](12) NOT NULL,
[TitleName] [nvarchar](100) NOT NULL,
[TitleType] [nvarchar](50) NOT NULL,
[PublisherKey] [int] NOT NULL,
[TitlePrice] [decimal](18, 4) NOT NULL,
[PublishedDateKey] [int] NOT NULL
)
GO
--Create the Fact Tables
CREATE TABLE [dbo].[FactTitlesAuthors](
[TitleKey] [int] NOT NULL,
[AuthorKey] [int] NOT NULL,
[AuthorOrder] [int] NOT NULL,
CONSTRAINT [PK_FactTitlesAuthors] PRIMARY KEY CLUSTERED
( [TitleKey] ASC, [AuthorKey] ASC )
)
GO
CREATE TABLE [dbo].[FactSales](
[OrderNumber] [nvarchar](50) NOT NULL,
[OrderDateKey] [int] NOT NULL,
[TitleKey] [int] NOT NULL,
[StoreKey] [int] NOT NULL,
[SalesQuantity] [int] NOT NULL,
CONSTRAINT [PK_FactSales] PRIMARY KEY CLUSTERED
( [OrderNumber] ASC,[OrderDateKey] ASC, [TitleKey] ASC, [StoreKey] ASC )
)
GO
--Add Foreign Keys
ALTER TABLE [dbo].[DimTitles] WITH CHECK ADD CONSTRAINT [FK_DimTitles_DimPublishers]
FOREIGN KEY([PublisherKey]) REFERENCES [dbo].[DimPublishers] ([PublisherKey])
GO
ALTER TABLE [dbo].[FactTitlesAuthors] WITH CHECK ADD CONSTRAINT
[FK_FactTitlesAuthors_DimAuthors]
FOREIGN KEY([AuthorKey]) REFERENCES [dbo].[DimAuthors] ([AuthorKey])
GO
ALTER TABLE [dbo].[FactTitlesAuthors] WITH CHECK ADD CONSTRAINT
[FK_FactTitlesAuthors_DimTitles]
FOREIGN KEY([TitleKey]) REFERENCES [dbo].[DimTitles] ([TitleKey])
GO
ALTER TABLE [dbo].[FactSales] WITH CHECK ADD CONSTRAINT [FK_FactSales_DimStores]
FOREIGN KEY([StoreKey]) REFERENCES [dbo].[DimStores] ([Storekey])
GO
ALTER TABLE [dbo].[FactSales] WITH CHECK ADD CONSTRAINT [FK_FactSales_DimTitles]
FOREIGN KEY([TitleKey]) REFERENCES [dbo].[DimTitles] ([TitleKey])
GO
ALTER TABLE [dbo].[FactSales] WITH CHECK ADD CONSTRAINT [FK_FactSales_DimDates]
FOREIGN KEY([OrderDateKey]) REFERENCES [dbo].[DimDates] ([DateKey])
GO
ALTER TABLE [dbo].[DimTitles] WITH CHECK ADD CONSTRAINT [FK_DimTitles_DimDates]
FOREIGN KEY([PublishedDateKey]) REFERENCES [dbo].[DimDates] ([DateKey])
GO

/*
STEP 3
Back up new database to disk placing the file in the directory nominated
and restore database using the back up file replacing the one already created
with the backed up one
*/
BACKUP DATABASE [DW_Sample]
TO DISK =
N'C:\DW_Sample_Files\DW_Sample_BackUp\DW_Sample.bak'
GO
USE [Master]
RESTORE DATABASE [DW_Sample]
FROM DISK =
N'C:\DW_Sample_Files\DW_Sample_BackUp\DW_Sample.bak'
WITH REPLACE
GO
ALTER DATABASE [DW_Sample]
SET MULTI_USER
After successful code execution you should be left roughly the same message as per image below.
This concludes this post and, as usual, all code samples and solution files can be found and downloaded from HERE. In the NEXT POST I would like to dig dipper into technical aspects of a data mart development and touch on SQL which is used to populate the data mart tables which will later become a prelude to SSIS package structure and design in subsequent post.
Please also check other posts from this series:
- How To Build A Data Mart Using Microsoft BI Stack Part 1 – Introduction and OLTP Database Analysis
- How To Build A Data Mart Using Microsoft BI Stack Part 3 – Database Load Approach And Coding
- How To Build A Data Mart Using Microsoft BI Stack Part 4 – Data Mart Load Using SSIS
- How To Build A Data Mart Using Microsoft BI Stack Part 5 – Defining SSAS Project And Its Dimensions
- How To Build A Data Mart Using Microsoft BI Stack Part 6 – Refining SSAS Data Warehouse Dimensions
- How To Build A Data Mart Using Microsoft BI Stack Part 7 – Cube Creation, Cube Deployment And Data Validation
- How To Build A Data Mart Using Microsoft BI Stack Part 8 – Creating Sample SSRS Report
All SQL code and solution files can be found and downloaded from HERE.


Never thought Polybase could be used in this capacity and don't think Microsoft advertised this feature (off-loading DB data as…