Vertica MPP Database Overview and TPC-DS Benchmark Performance Analysis (Part 2)
In Post 1 I outlined the key architectural principles behind Vertica’s design and what makes it one of the top MPP/analytical databases available today. In this instalment, I will go through the database installation process (across a single and multiple nodes), some of the issues I encountered (specific to the off-the-shelf hardware I used) as well as some other titbits regarding subsequent configuration and tuning. For a TLDR version of Vertica installation process you can watch the following video instead.
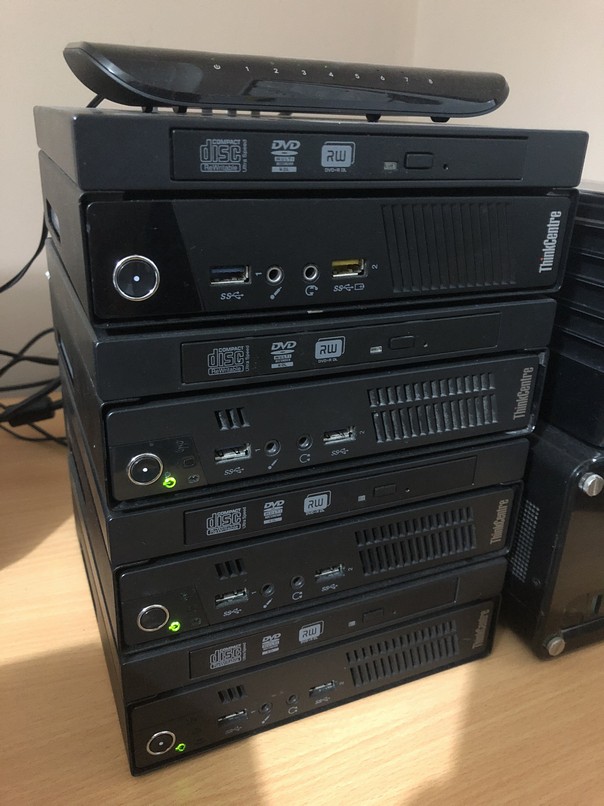
Vertica can be installed on any compatible x86 architecture hardware so for the purpose of this demo I decided dust off a few of my old and trusty Lenovo m92p units. Even though these machines are typically used to run desktop class applications in an office environment, they still should provide a decent evaluation platform if one wants to kick the tires on Vertica installation and configuration process. Heck, if Greenplum is proud to run their MPP database on a cluster of Raspberries Pi (check out the video HERE), why not run Vertica on a stack of low-powered Lenovo desktops under Ubuntu Server. Below is a photo of the actual machines running Vertica version 9.1 fitted with Intel Core i5 3470 CPU, 16GB of DDR3 memory and 512GB of Crucial MX300 SSD in each of the three nodes (bottom three units).
Installing Vertica
Before installing Vertica, the following key points should be taken into consideration.
- Only one database instance can run per cluster. So, if we were to provision a three-node cluster, then all three nodes will be dedicated to one single database.
- Only one instance of Vertica is allowed to run on a host at any time.
- Only the root user or the user with the privileges (sudo) can run the install_vertica script.
Vertica installation process also imposes some rigid requirements around swap space available, dynamic CPU scaling, network configuration and disk space and memory requirements. As these are quite comprehensive in terms of actual Linux side configuration I won’t go into details on how these requirements and their parameters need to be tuned and adjusted (beyond the issues I encountered and the fixes I performed) as Vertica’s documentation available on their website outlines all these options in great details.
Below is a step by step overview of how to install Vertica (single node configuration) on Ubuntu Server 14.04 LTS with some of the problems encountered and the fixes implemented to rectify them. I will also provide details on how to add nodes to existing installation towards the end of this post.
To install Vertica as a single node cluster the following steps will be applied:
- Download the Vertica installation package from the vendor’s website according to the Linux OS applicable to your environment. In my case, I used Ubuntu Server 14.04 LTS release so majority of the steps below apply to this particular Linux distribution.
- Disable firewall.
sudo ufw disable
- Install supporting packages.
#required for interactivity with Administration Tools
apt-get install dialog
#required for Administration Tools connectivity between nodes
apt-get install openssh
- Install the downloaded package using standard comma
sudo dpkg -i /pathname/vertica_x.x.x.x.x.deb
- Install Vertica by running the install_vertica script with the required parameters supplied.
/opt/vertica/sbin/install_vertica --hosts node0001,node0002,node0003\
--deb /tmp/vertica_9.0.x.x86_64.deb
--dba-user dbadmin
In my case the initiated installation failed reporting the following errors (last three FAIL statements).
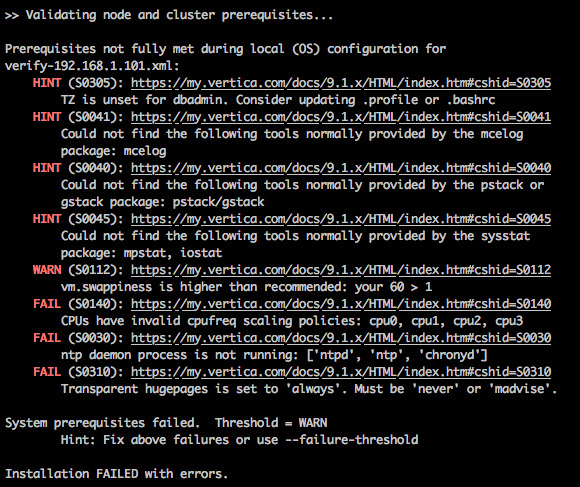
First issue related to the system reporting invalid CPU scaling. The installer allows CPU frequency scaling to be enabled when cpufreq scaling governor is set to performance. If the CPU scaling governor is set to on-demand, and ignore_nice_load is 1 (true), then the installer fails with the error S0140. CPU scaling is a hardware and software feature that helps computers conserver energy by slowing the processor when the system load is low, and speeding it up again when the system load increases. Typically, you disable the CPU scaling in the hosts’s BIOS but as it was the case with my machine, the settings tweaking did nothing to discourage Vertica installer from throwing the error presumably due to the fact I was running the T version of Intel CPU i.e. ‘Power-optimised lifestyle’. The next best thing to do was to tweak it through the Linux kernel or setting the CPU frequency governor to always run the CPU at full speed.
This can be fixed by installing cpufrequtils package and manually changing the CPU governor’s settings.
apt-get install cpufrequtils
sudo cpufreq-set -c 0 -g performance
sudo cpufreq-set -c 1 -g performance
sudo cpufreq-set -c 2 -g performance
sudo cpufreq-set -c 3 -g performance
Next, the installer raised an issue with the ntp deamon not running. The network time protocol (NTP) deamon must be running on all of the nodes in the cluster so that their clocks are synchronised for timing purposes. By default, the NPT deamon is not installed on some Ubuntu and Debian systems. First, let’s install it and start the NTP process.
sudo apt-get install ntp
sudo /etc/init.d/ntp reload
To verify the the Network Time Protocol deamon is operating correctly we can issue the following command on all nodes in the cluster.
ntpq -c rv | grep stratum
A stratum level of 16 indicates that NTP is not synchronising correctly. If a stratum level of 16 is detected, wait 15 minutes and issue the command again. If NTP continues to detect a stratum level of 16, verify that the NTP port (UDP Port 123) is open on all firewalls between the cluster and the remote machine to which you are attempting to synchronise.
Finally, the installer also complained that ‘the transparent hugepages is set to always and that it must be set to never or madvise. This can be ractified by editing the boot loader (for example /etc/grub.conf) or editing /etc/rc.local (on a system that supports rc.local) and adding the following script.
if test -f /sys/kernel/mm/transparent_hugepages/enabled; then
echo never > /sys/kernel/mm/transparent_hugepages/enabled
fi
Regardless of the approach, you must reboot your system for the settings to take effect, or run the following to echo lines to proceed with the install without rebooting.
sudo su
echo never > /sys/kernel/mm/transparent_hugepage/enabled
Next, when trying to run the installation script again, another issue (this time a warning) about swappiness came up as per the image below.
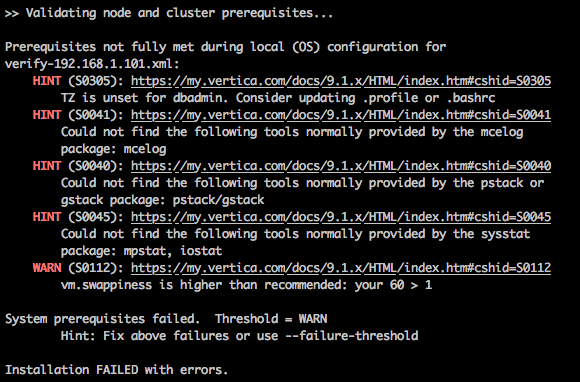
The swappiness kernel parameter defines the amount, and how often, the kernel copies RAM contents to a swap space. Vertica recommends a value of 1. To fix this issue we can run the following command to alter the parameter value.
echo 1 > /proc/sys/vm/swappiness
Fortunately, after rectifying the swappiness issue rest of the installation went trouble-free.
- After we have installed Vertica on all desired nodes, it’s time to create a database. Log in as a new user (dbadmin in default scenarios) and connect to the admin panel by running the followinmand.
/opt/vertica/bin/adminTools
- If you are connecting to admin tools for the first time, you will be prompted for a license key. Since we’re using the community edition we will just leave it blank and click OK.
- After accepting EULA we can navigate to Administration Tools | Configuration Menu | Create Database menu and provide the database name and password.
- Once the database is created we can connect to it using VSQL tool to perform admin tasks. Vertica also allows administrators to invoke most Administration Tools from the command line or a shell script. We can list all available tools and their commands and options in individual help text as per below.
$ admintools -a
Usage:
    adminTools [-t | --tool] toolName [options]
Valid tools are:
                command_host
                connect_db
                create_db
                database_parameters
                db_add_node
                db_remove_node
                db_replace_node
                db_status
                distribute_config_files
                drop_db
                host_to_node
                install_package
                install_procedure
                kill_host
                kill_node
                license_audit
                list_allnodes
                list_db
                list_host
                list_node
                list_packages
                logrotate
                node_map
                re_ip
                rebalance_data
                restart_db
                restart_node
                return_epoch
                revive_db
                set_restart_policy
                set_ssl_params
                show_active_db
                start_db
                stop_db
                stop_host
                stop_node
                uninstall_package
                upgrade_license_key
                view_cluster
Each tool comes with its own parameters. For example, the following three examples display the command option for command_host, connect_db and create_db tools.
Usage: command_host [options]

Options:
  -h, --help            show this help message and exit
  -c CMD, --command=CMD
                        Command to run
-------------------------------------------------------------------------
Usage: connect_db [options]

Options:
  -h, --help            show this help message and exit
  -d DB, --database=DB  Name of database to connect
  -p DBPASSWORD, --password=DBPASSWORD
                        Database password in single quotes
-------------------------------------------------------------------------
Usage: create_db [options]

Options:
  -h, --help            show this help message and exit
  -D DATA, --data_path=DATA
                        Path of data directory[optional] if not using compat21
  -c CATALOG, --catalog_path=CATALOG
                        Path of catalog directory[optional] if not using
                        compat21
  --compat21            (deprecated) Use Vertica 2.1 method using node names
                        instead of hostnames
  -d DB, --database=DB  Name of database to be created
  -l LICENSEFILE, --license=LICENSEFILE
                        Database license [optional]
  -p DBPASSWORD, --password=DBPASSWORD
                        Database password in single quotes [optional]
  -P POLICY, --policy=POLICY
                        Database restart policy [optional]
  -s NODES, --hosts=NODES
                        comma-separated list of hosts to participate in
                        database
  --skip-fs-checks      Skip file system checks while creating a database (not
                        recommended).
The Management Console provides some, but not all, of the functionality that the Administration Tools provides. In addition, the MC provides extended functionality not available in the Administration Tools, such as a graphical view of your Vertica database and detailed monitoring charts and graphs.
To install MC download the MC package from myVertica portal and save it to a location on the target server, such as /tmp. On the target server, log in as root or a user with sudo privileges, change directory to the location where you saved the MC package and install MC using your local Linux distribution package management system (for example, rpm, yum, zipper, apt, dpkg). In my case, since I run Ubuntu Server that will look like the following.
sudo dpkg -i vertica-console-<current-version>.deb
Next, open a browser and enter the IP address or host name of the server on which you installed MC, as well as the default MC port 5450. For example, you’ll enter one of the following.
https://xx.xx.xx.xx:5450/
https://hostname:5450/
When the Configuration Wizard dialog box appears, proceed to Configuring Management Console.
Vertica being a distributed database stores and retrieves data from multiple nodes in a typical setup. There are many reasons for adding one or more nodes to an installation of Vertica e.g. make a database K-safe, swapping nodes for maintenance or replacing/removing a node due to, for example, a malfunctioning hardware. To add a new node, we can use the update_vertica script. However, before adding a node to an existing cluster, the following prerequisites have to be kept in mind.
- Make sure that the database is running.
- Newly added node should be reachable by all existing nodes in the cluster.
- Generally, it is not needed to shut down the Vertica database for expansion, but a shutdown is necessary if we are expending it from a single node cluster.
Adding a new node is as simple as running the after mentioned update_vertica script e.g.
/opt/vertica/sbin/update_vetica --add-hosts host(s) -deb package
The update_vertica script uses all the same options as install_vertica script and beyond Vertica installation it performs post-installation checks, modifies spread to encompass the larger cluster and configures the Admin Tools to work with the larger cluster.
Once you have added one or more hosts to the cluster, you can add them as nodes to the database. This can be accomplished using either the Management Console interface or the Administration Tools interface or alternatively the admintools command line (to preserve the specific order of the nodes you add). As adding nodes in the MC is GUI driven and thus very straightforward, the following process outlines how to use Administration Tools instead.
- Open the Administration Tools.
- One the Main Menu, select View Database Cluster State to verify that the database is running. If it is not, start it.
- From the Main Menu, select Advanced Tools Menu and click OK.
- In the Advanced Menu, select Cluster Management and click OK.
- In the Cluster Management menu, select Add Host(s) and click OK.
- Select the database to which you want to add or remove hosts, and then select OK. A list of unused hosts is displayed.
- Select the hosts you want to add to the database and click OK
- When prompted, click Yes to confirm that you want to add the hosts.
- When prompted, enter the password for the database and then select OK.
- When prompted that the hosts were successfully added, select OK.
- Vertica now automatically starts the rebalancing process to populate the new node with data. When prompted, enter the path to a temporary directory that the Database Designer can use to rebalance the data in the database and select OK.
- Either press enter to accept the default K-safety value, or enter a new higher value for the database and select OK.
- Select whether Vertica should immediately start rebalancing the database, or whether it should create a script to rebalance the database later.
- Review the summary of the rebalancing process and select Proceed.
- If you chose to automatically rebalance, the rebalance process runs. If you chose to create a script, the script is generated and saved. In either case, you are shown a success screen, and prompted to select OK to end the Add Node process.
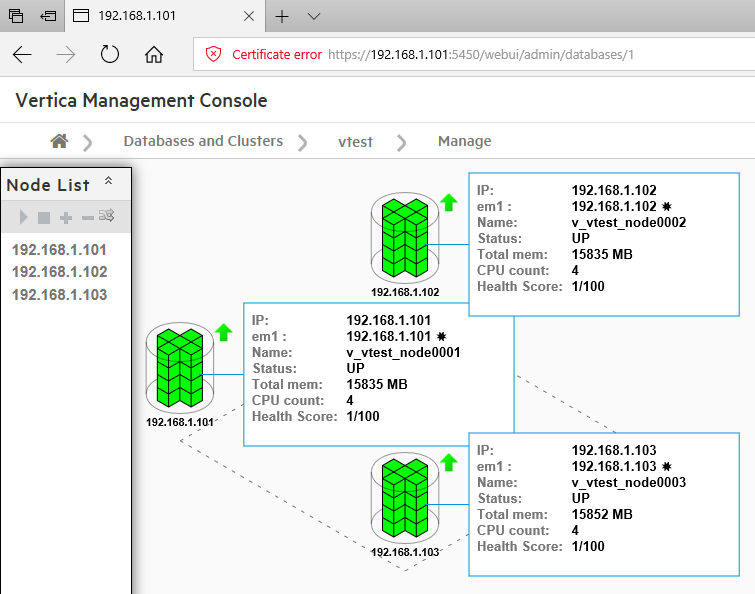
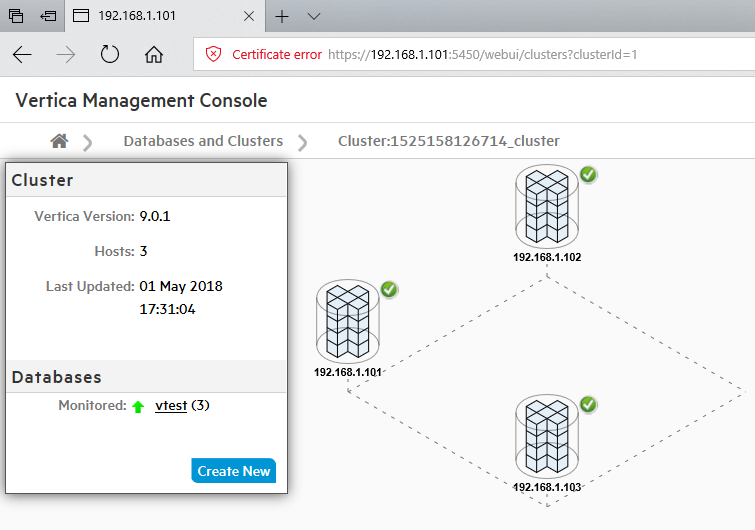
Since this demo uses three hosts (maximum allowed to kick some tires and try Vertica without an enterprise license), once configured and set up, this is how the cluster looks like in the management console (database and hosts views).
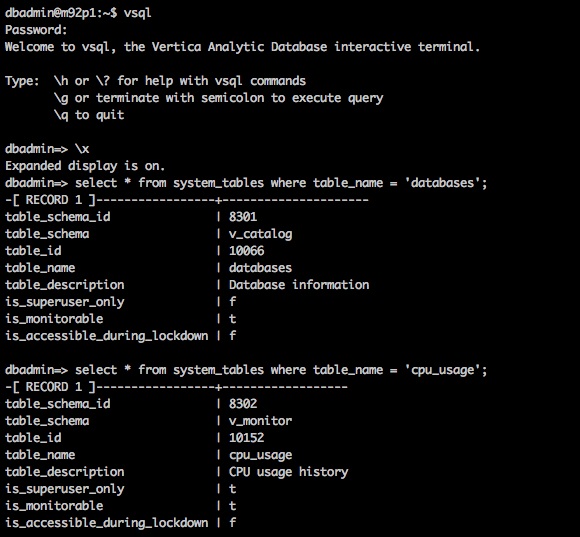
Aside from the Management Console interface, various parts of Vertica database can be administered and monitored via the system tables and log files. Vertica provides an API (application programming interface) for monitoring various features and functions within a database in the form of system tables. These tables provide a robust, stable set of views that let you monitor information about your system’s resources, background processes, workload, and performance, allowing you to more efficiently profile, diagnose, and view historical data equivalent to load streams, query profiles, tuple mover operations, and more. Because Vertica collects and retains this information automatically, you don’t have to manually set anything. You can write queries against system tables with full SELECT support the same way you perform query operations on base and temporary tables. You can query system tables using expressions, predicates, aggregates, analytics, subqueries, and joins. You can also save system table query results into a user table for future analysis.
System tables are grouped into the following schemas:
- V_CATALOG – information about persistent objects in the catalog
- V_MONITOR – information about transient system state
These schemas reside in the default search path so there is no need to specify schema.table in your queries unless you change the search path to exclude V_MONITOR or V_CATALOG or both. Most of the tables are grouped into the following areas:
- System Information
- System resources
- Background processes
- Workload and performance
The following two queries outline metadata information for two tables – databases and cpu_usage – from their respective v_catalog and v_monitor schemas.
Vertica also collects and logs various system events which can help in troubleshooting and general system performance. The events are collected in the following ways.
- In the Vertica.log file
- In the ACTIVE_EVENTS system table
- Using SNMP
- Using Syslog
This concludes Vertica installation process. Even though I came across a few issues, those were mainly specific to the hardware configuration I used for this demo and in a ‘real-world scenario’ Vertica installation process is usually trouble-free and can be accomplished in less then 30min. In the next post I will go through the data used for the TPC-DS benchmark testing, loading mechanism, some of the performance considerations imposed by its volume and hardware specifications used and provide an overview of the results of the first ten queries I run. For the remaining ten queries’ results as well as PowerBI and Tableau interactions please see the final instalment to this series – post 4 HERE.
http://scuttle.org/bookmarks.php/pass?action=addThis entry was posted on Thursday, February 1st, 2018 at 12:45 am and is filed under MPP RDBMS, SQL. You can follow any responses to this entry through the RSS 2.0 feed. You can leave a response, or trackback from your own site.


Hello Kind of what I've been looking for - thanks for posting. I don't use Snowflake but gives me an…